WLSDM for 
Writing and deploying a WLST script for a WebLogic domain is about one hour, installation of WLSDM is one minute...
No need to write WLST scripts anymore. Use WLSDM instead!
- Writing and deploying a WLST script for a WebLogic domain is about one hour, installation of WLSDM is one minute. WLSDM is a "Plug & Play" solution. After WLSDM installation all your current WLST scripts are ready to use and start monitoring your WebLogic domain resources and increase your WebLogic domain performance immediately.
- While monitoring WebLogic domains mostly administrators prefer to use WLST (WebLogic Scripting Tool) scripts but there are more efficient and robust way available to monitor WebLogic domain resources like health status and states of servers (JVMs), deployments, data sources and JMS resources etc.
- WLST scripts are volatile and it is really difficult to transfer know-how from one team member to another. Setup a real and pro solution at your company and increase the operational excellence quality real fast.
Comparison of WLST and WLSDM
"wlst weblogic"
"wlst serverRuntme()"
"weblogic server health"
"wlst state"
"wlst application" "wlst commands"Monitoring WebLogic Health (Servers, Deployments, Data Sources and JMS Servers)
WLST
WLSDM
Monitoring WebLogic States (Servers, Deployments, Data Sources and JMS Servers)
WLST
WLSDM
Monitoring WebLogic JVM Resources
WLST
WLSDM
Monitoring Machine (Server or VM) Resources
WLST
WLSDM
Script Automation
WLST
WLSDM
Script Visual Cron Expression
WLST
WLSDM
HTML Email Support
WLST
WLSDM
If/Else Output Action
WLST
WLSDM
Dynamic Threshold
WLST
WLSDM
SQL Support and Integration
WLST
WLSDM
Shell Support and Integration
WLST
WLSDM
Generic JMX DevOps MBean
WLST
WLSDM
CLEAR Notifications
WLST
WLSDM
WLST Web Console
WLST
WLSDM
Historical MBean Values and Reports
WLST
WLSDM
Visual Charts and Dashboards
WLST
WLSDM
Script Know-How Transfer and Documentation (Team Alignment)
WLST
WLSDM
Professional Support
WLST
WLSDM
Writing and Deploying WLST Scripts vs. WLSDM: Frequently Asked Questions
"wlst osb oracle service bus"
"wlst soa suite 11g 12c composite states"
"how to run wlst script in windows wlst.cmd"
"how to runt wlst script in linux wlst.sh"
"weblogic 12c wlst examples" "wlst 12c"You are able to write WLST script to monitor WebLogic server (JVM) "health status" for WebLogic server (JVM), data source, deployment and JMS resources.
Use WLSDM instead. Because you are going to have additional features.
- Monitoring WebLogic servers (JVM), deployments, data sources and JMS servers "HEALTH STATUS" available by default on WLSDM
- CLEAR notifications are available on WLSDM for health statuses. When a server health status backs to normal WLSDM sends CLEAR notifications that problems are resolved
- Downtime feature is available. Configure downtime and auto stop ALERT notifications
- Available WebLogic Health Status and States to be monitored by WLSDM continuously:
"Shutdown", "Failed", "Critical", "Overloaded", "Warning", "OK"
White Paper: Native WebLogic FMW Performance Monitoring and Diagnostics
You are able to write WLST script to monitor WebLogic server (JVM) "states" for WebLogic server (JVM), data source, deployment and JMS resources.
Use WLSDM instead. Because you are going to have additional features.
- Monitoring WebLogic servers (JVM), deployments, data sources and JMS servers "STATES" available by default on WLSDM
- CLEAR notifications are available on WLSDM for states. When a server state backs to normal WLSDM sends CLEAR notifications that problems are resolved
- Downtime feature is available. Configure downtime and auto stop ALERT notifications for the states
- Available WebLogic Server, Deployment, Data Source and JMS STATES to be monitored by WLSDM continuously;
WLSDM monitors "Oracle WebLogic Server States", "Oracle WebLogic Deployment Sates", "Oracle WebLogic Data Source States", "Oracle WebLogic JMS Server States":
"SHUTDOWN", "STARTING", "RUNNING", "STANDBY", "SUSPENDING", "FORCE_SUSPENDING", "RESUMING", "SHUTTING_DOWN", "FAILED", "UNKNOWN", "SHUTDOWN_PENDING", "SHUTDOWN_IN_PROCESS", "FAILED_RESTARTING", "ACTIVATE_LATER", "FAILED_NOT_RESTARTABLE", "FAILED_MIGRATABLE", "DISCOVERED", "ADMIN", "FORCE_SHUTTING_DOWN", "INITIALIZING", "STATE_UPDATE_PENDING", "NEW" "INSTALLED", "ACTIVE"
White Paper: Native and Central WebLogic FMW Performance Monitoring
WLST Example Codes
"wlst connect"
"wlst stuck"
"run wlst script"
"wlst soa"
"weblogic fmw components wlst script" "weblogic heap configuation"
# Node Manager needs to be running to run this script.

import thread
import time

def checkHealth(serverName):
  while 1:
    slBean = getSLCRT(serverName)
    status = slBean.getState()
    print 'Status of Managed Server is '+status
    if status != "RUNNING":
      print 'Starting server '+serverName
      start(serverName, block="true")
    time.sleep(5)

def getSLCRT(svrName):
    domainRuntime()
    slrBean = cmo.lookupServerLifecycleRuntime(svrName)
    return slrBean

checkHealth("myserver")
Reference: https://docs.oracle.com/middleware/1221/wls/WLSTG/monitoring.htm#WLSTG231
"weblogic heap size"
"weblogic heap usage"
"weblogic cpu consumer linux thread kill -3"
"weblogic cpu dump npss"
"weblogic cpu sample and analyze cpu sampler" "weblogic deployment health cases"
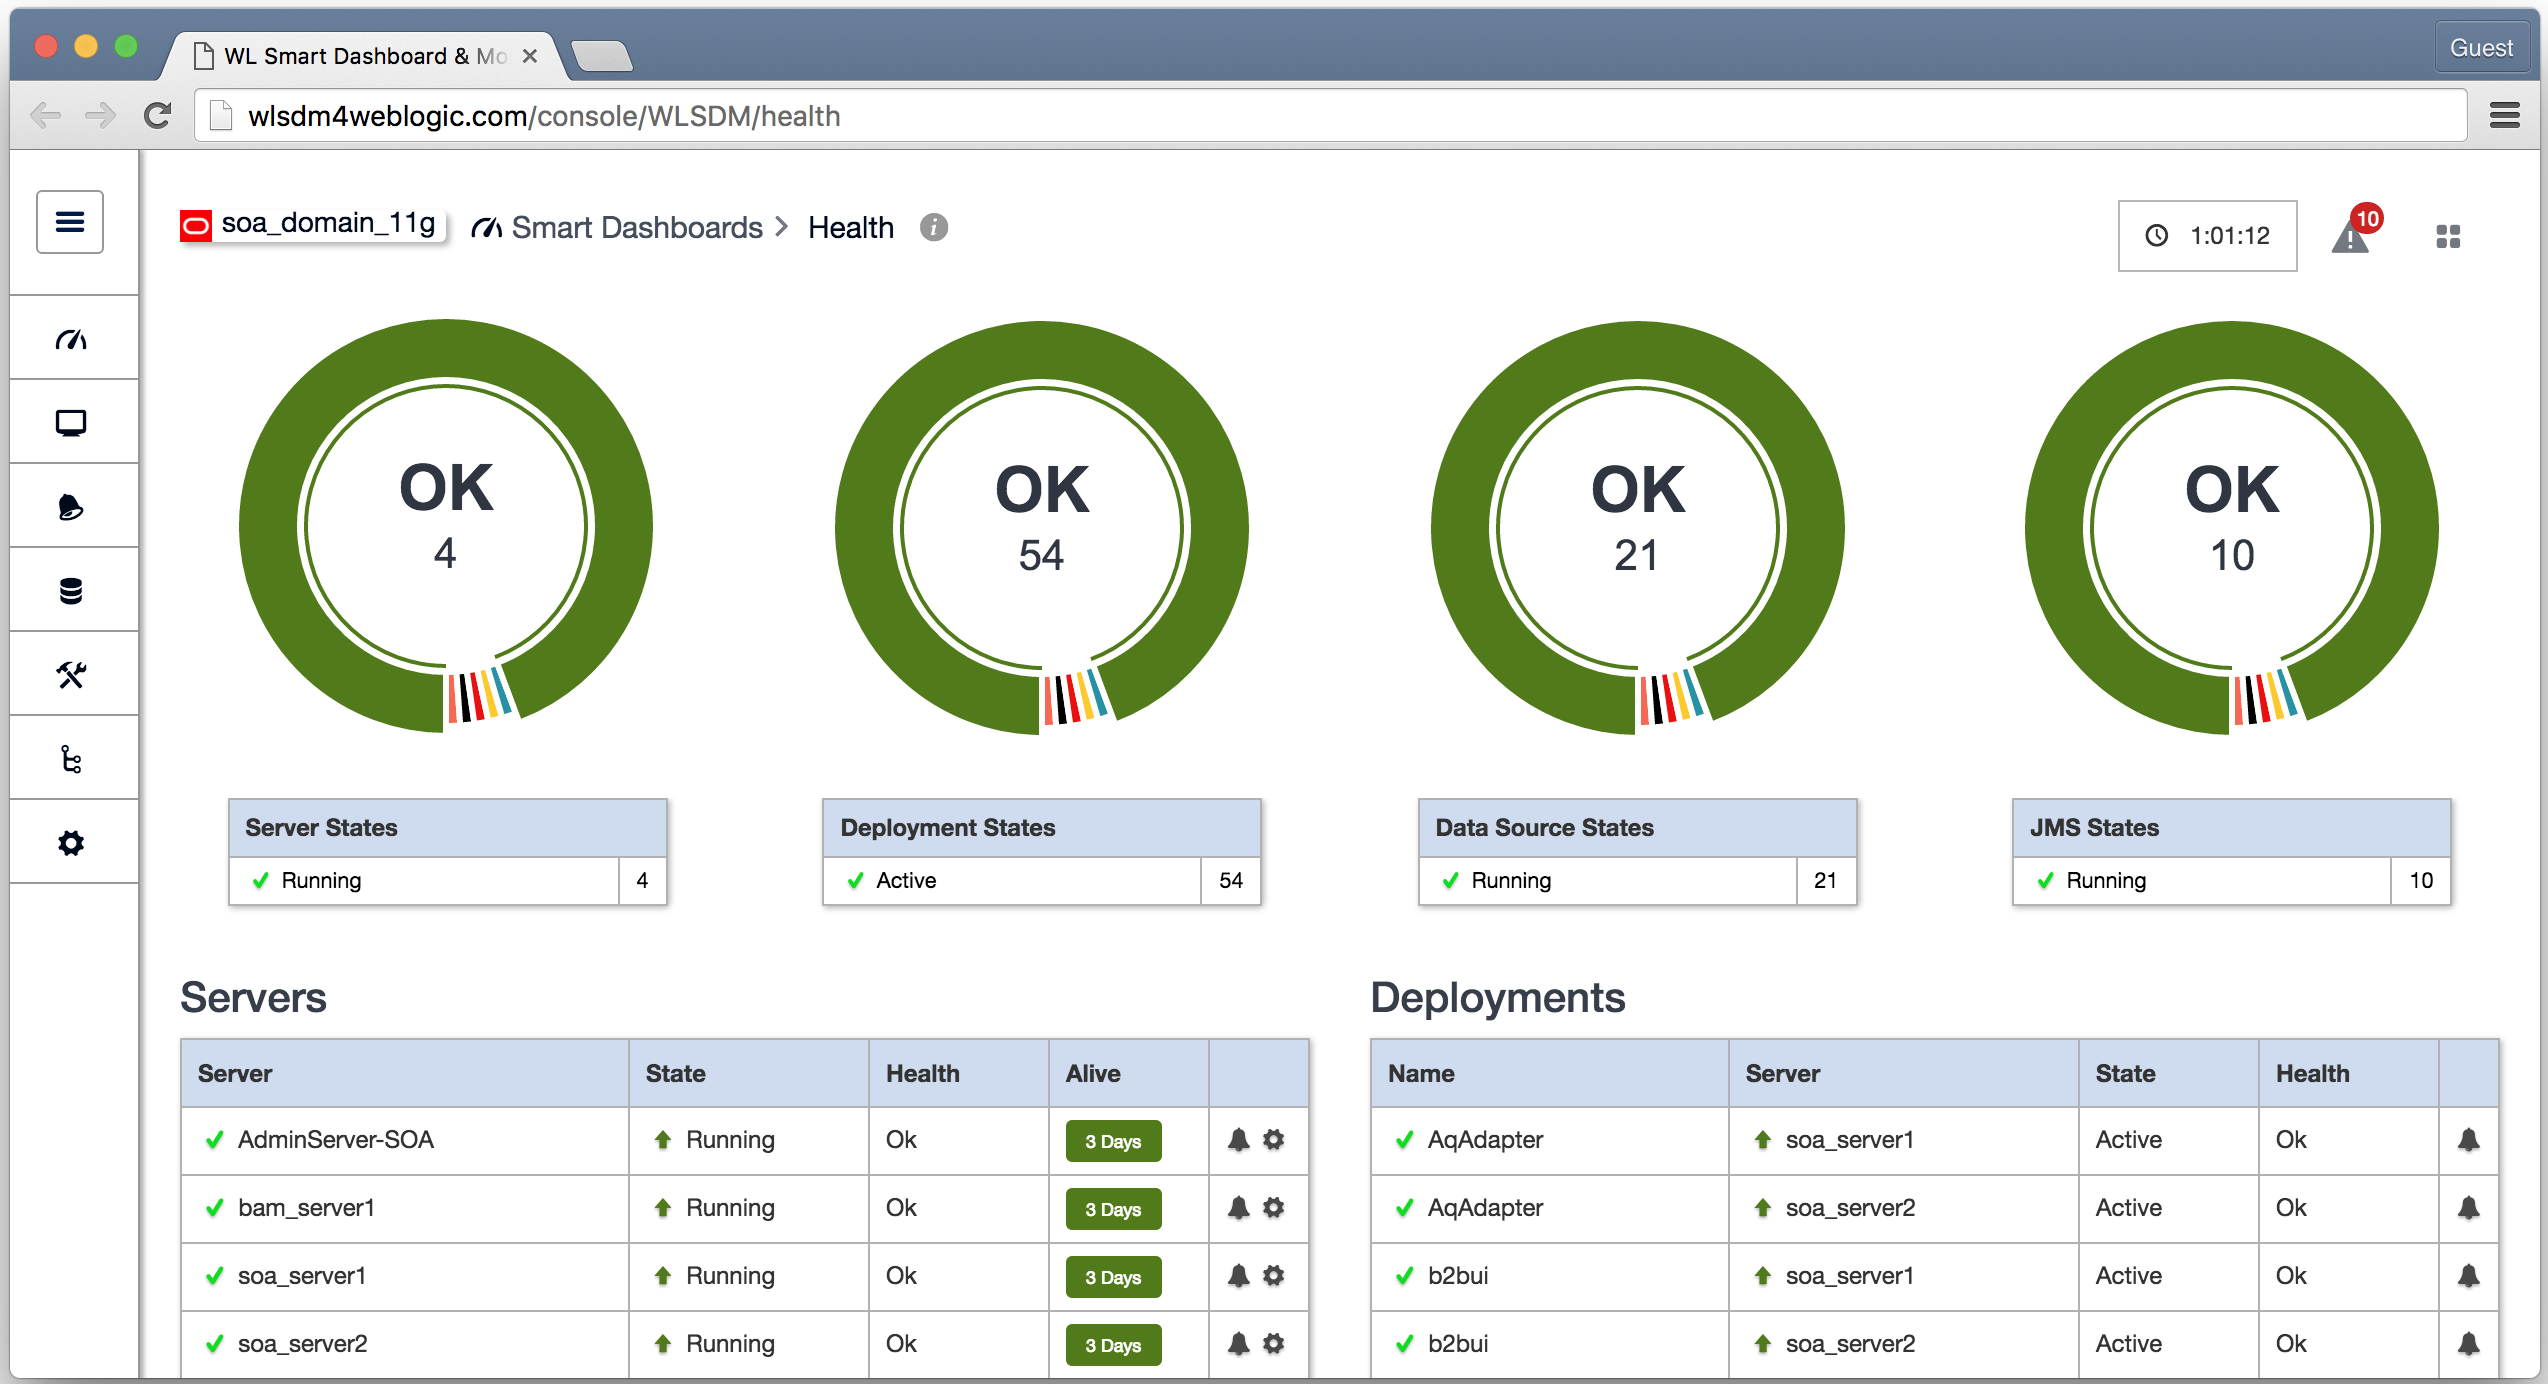
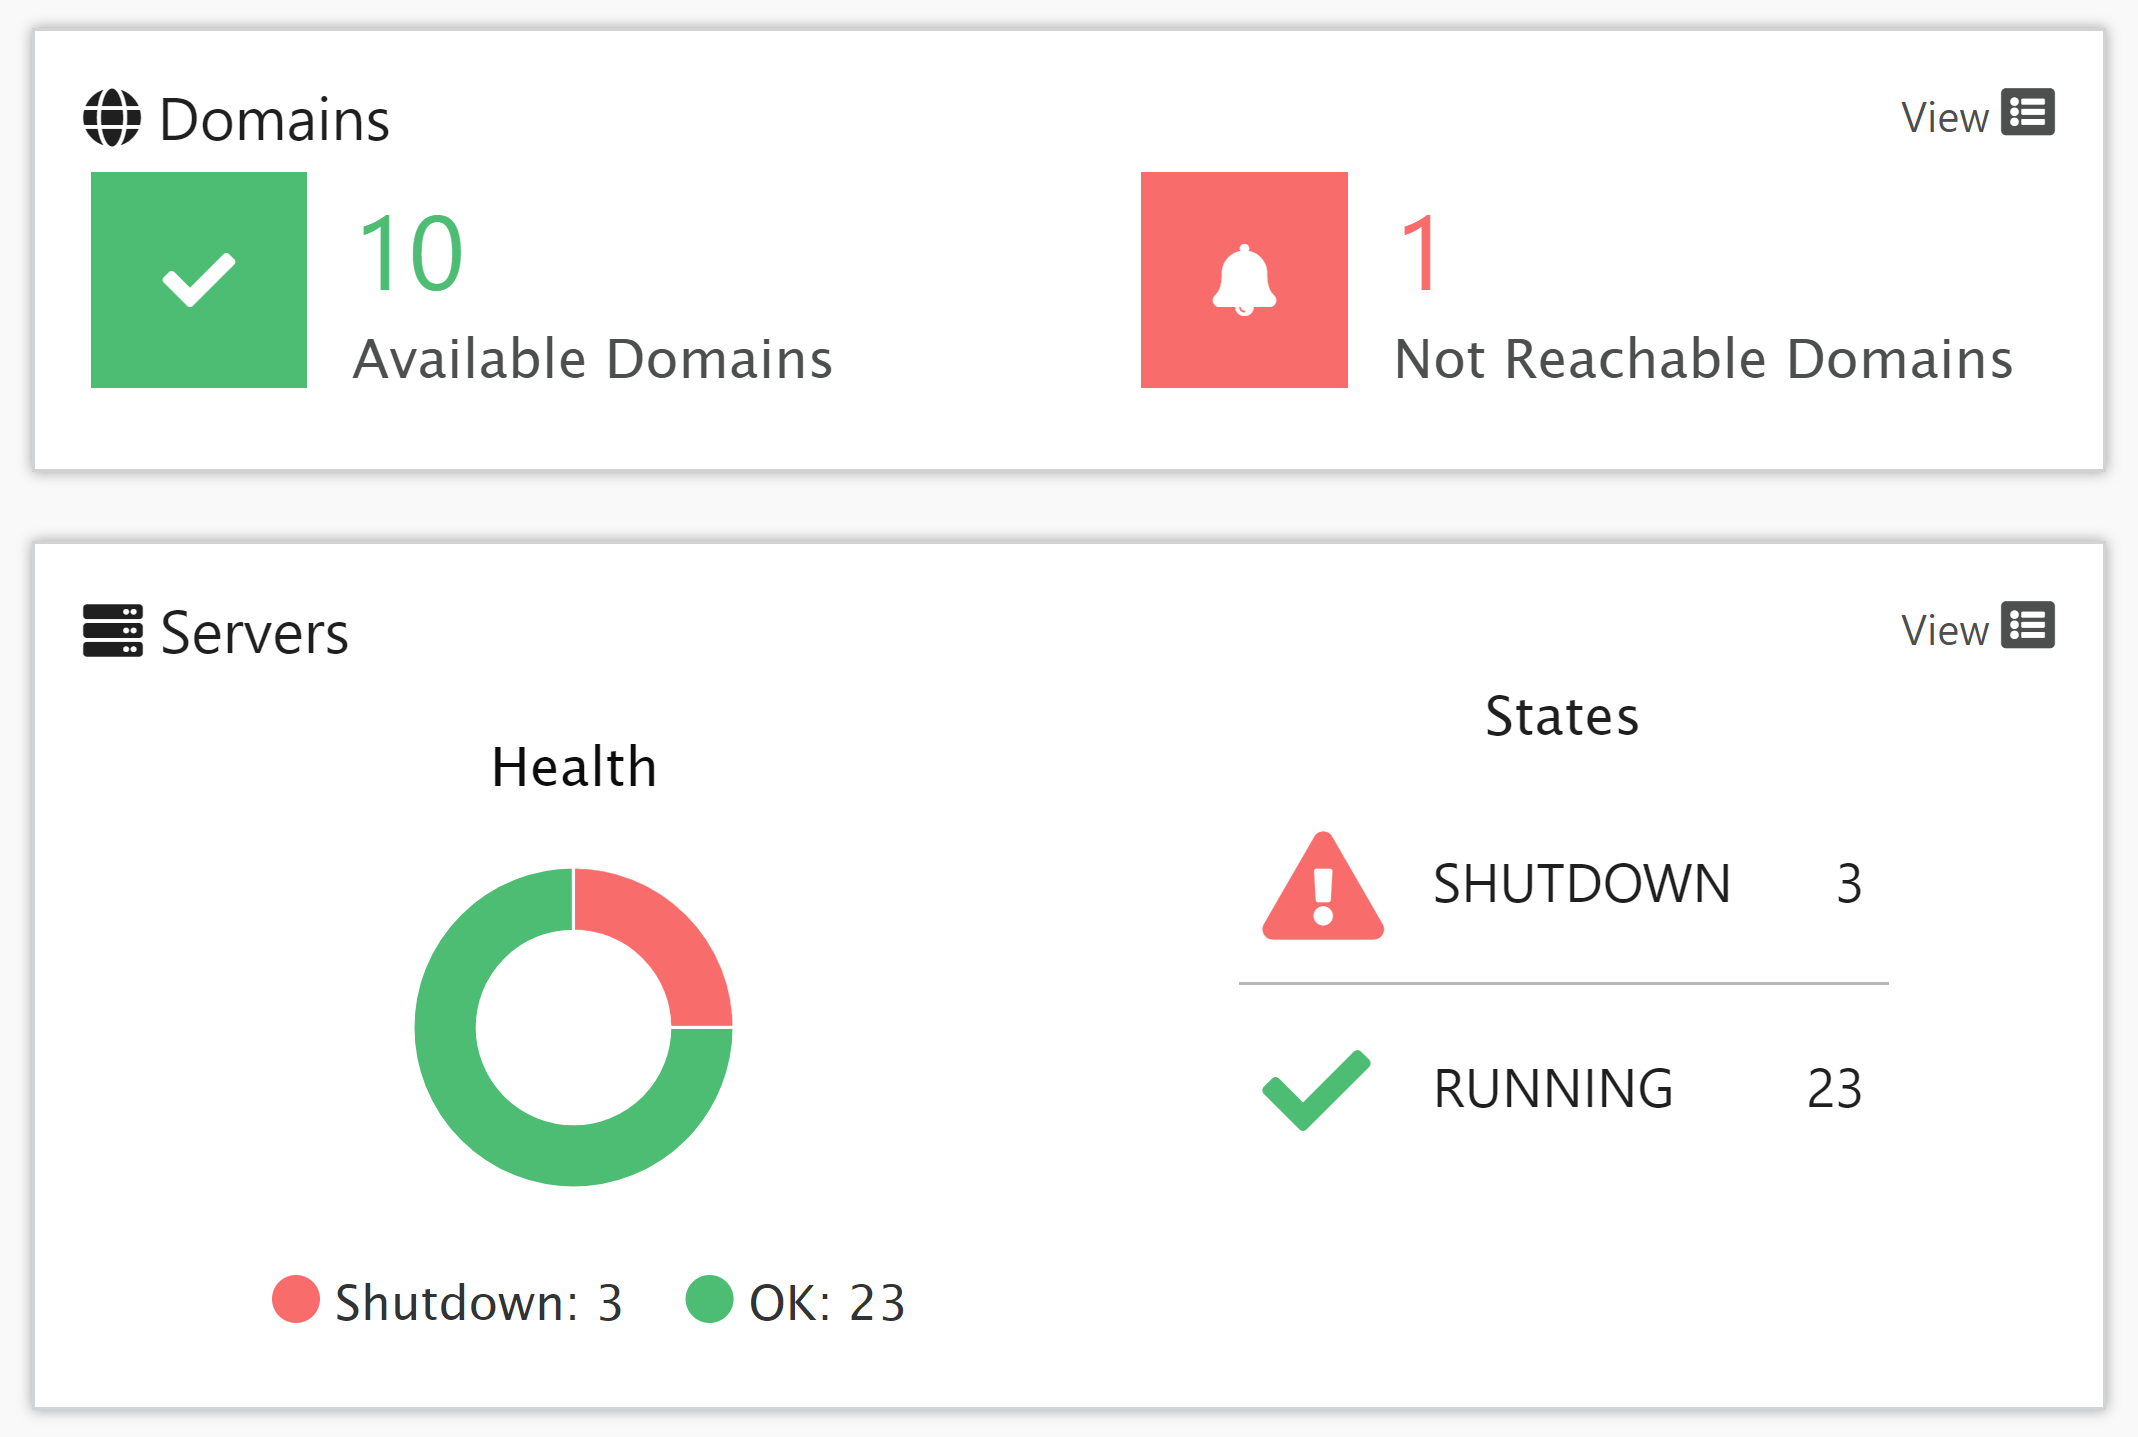
Health Monitoring and Health Dashboard
Q: How to monitor Oracle WebLogic Server health and states?
A: WLSDM has health dashboard and you are able to monitor every detail about WebLogic health details:
- WebLogic Server Health
- WebLogic Server States
- Health/State ALERT and CLEAR emails
- Data Source Health/State
- Deployments Health/State
- JMS Server Health/States
Reference: https://wlsdm.com/docs/document-index
"weblogic jfr"
"weblogic jfr analyze"
"java mission control jmc weblogic"
"weblogic mbean browser"
"weblogic mbean search" "weblogic scheduler for wlst scripts"
waitTime=180000
THRESHOLD=300000000
uname = "adminusername"
pwd = "adminpassword"
url = "t3://localhost:7001"
def monitorJVMHeapSize():
    connect(uname, pwd, url)
    while 1:
        serverNames = getRunningServerNames()
        domainRuntime()
        for name in serverNames:
            print 'Now checking '+name.getName()
            try:
              cd("/ServerRuntimes/"+name.getName()+"/JVMRuntime/"+name.getName())
              heapSize = cmo.getHeapSizeCurrent()
              if heapSize > THRESHOLD:
              # do whatever is neccessary, send alerts, send email etc
                print 'WARNING: The HEAPSIZE is Greater than the Threshold'
              else:
                print heapSize
            except WLSTException,e:
              # this typically means the server is not active, just ignore
              # pass
                print "Ignoring exception " + e.getMessage()
            java.lang.Thread.sleep(waitTime)

def getRunningServerNames():
        # only returns the currently running servers in the domain
        return domainRuntimeService.getServerRuntimes()

if __name__== "main":
    monitorJVMHeapSize()
Reference: https://docs.oracle.com/middleware/1221/wls/WLSTG/monitoring.htm#WLSTG232

WLSDM JVM System Resources Dashboard Tutorial
Q: How to monitor WebLogic Managed Server, Admin Server JVM instances?
A:Go to "Smart Dashboards > JVM System Resource" page. You can monitor below WebLogic metrics easily on WLSDM.
- Server/JVM CPU Load
- Heap Usage
- Heap Size
- Heap Free Size
- Garbage Collection Durations
Reference: https://wlsdm.com/docs/document-index
"weblogic jms queue monitoring Destination Store and Forward brdige"
"weblogic datasource creation and monitoring datasource states with wlst
"weblogic action shell script"
"weblogic javaagent and jvm agent arguments"
"weblogic cron job wlst shell script health and states" "weblogic jmx metric mbean registration"
#############################################################################
#
# @author Copyright (c) 2010 - 2011 by Middleware Magic, All Rights Reserved.
#
#############################################################################

connect('weblogic','welcome1','t3://localhost:7001')

allServers=domainRuntimeService.getServerRuntimes();

if (len(allServers) > 0):

  for tempServer in allServers:

    jdbcServiceRT = tempServer.getJDBCServiceRuntime();

    dataSources = jdbcServiceRT.getJDBCDataSourceRuntimeMBeans();

    if (len(dataSources) > 0):

		for dataSource in dataSources:

			print 'ActiveConnectionsAverageCount      '  ,  dataSource.getActiveConnectionsAverageCount()
			print 'ActiveConnectionsCurrentCount      '  ,  dataSource.getActiveConnectionsCurrentCount()
			print 'ActiveConnectionsHighCount         '  ,  dataSource.getActiveConnectionsHighCount()
			print 'ConnectionDelayTime                '  ,  dataSource.getConnectionDelayTime()
			print 'ConnectionsTotalCount              '  ,  dataSource.getConnectionsTotalCount()
			print 'CurrCapacity                       '  ,  dataSource.getCurrCapacity()
			print 'CurrCapacityHighCount              '  ,  dataSource.getCurrCapacityHighCount()
			print 'DeploymentState                    '  ,  dataSource.getDeploymentState()
			print 'FailedReserveRequestCount          '  ,  dataSource.getFailedReserveRequestCount()
			print 'FailuresToReconnectCount           '  ,  dataSource.getFailuresToReconnectCount()
			print 'HighestNumAvailable                '  ,  dataSource.getHighestNumAvailable()
			print 'HighestNumUnavailable              '  ,  dataSource.getHighestNumUnavailable()
			print 'LeakedConnectionCount              '  ,  dataSource.getLeakedConnectionCount()
			print 'ModuleId                           '  ,  dataSource.getModuleId()
			print 'Name                               '  ,  dataSource.getName()
			print 'NumAvailable                       '  ,  dataSource.getNumAvailable()
			print 'NumUnavailable                     '  ,  dataSource.getNumUnavailable()
			print 'Parent                             '  ,  dataSource.getParent()
			print 'PrepStmtCacheAccessCount           '  ,  dataSource.getPrepStmtCacheAccessCount()
			print 'PrepStmtCacheAddCount              '  ,  dataSource.getPrepStmtCacheAddCount()
			print 'PrepStmtCacheCurrentSize           '  ,  dataSource.getPrepStmtCacheCurrentSize()
			print 'PrepStmtCacheDeleteCount           '  ,  dataSource.getPrepStmtCacheDeleteCount()
			print 'PrepStmtCacheHitCount              '  ,  dataSource.getPrepStmtCacheHitCount()
			print 'PrepStmtCacheMissCount             '  ,  dataSource.getPrepStmtCacheMissCount()
			print 'Properties                         '  ,  dataSource.getProperties()
			print 'ReserveRequestCount                '  ,  dataSource.getReserveRequestCount()
			print 'State                              '  ,  dataSource.getState()
			print 'Type                               '  ,  dataSource.getType()
			print 'VersionJDBCDriver                  '  ,  dataSource.getVersionJDBCDriver()
			print 'WaitingForConnectionCurrentCount   '  ,  dataSource.getWaitingForConnectionCurrentCount()
			print 'WaitingForConnectionFailureTotal   '  ,  dataSource.getWaitingForConnectionFailureTotal()
			print 'WaitingForConnectionHighCount      '  ,  dataSource.getWaitingForConnectionHighCount()
			print 'WaitingForConnectionSuccessTotal   '  ,  dataSource.getWaitingForConnectionSuccessTotal()
			print 'WaitingForConnectionTotal          '  ,  dataSource.getWaitingForConnectionTotal()
			print 'WaitSecondsHighCount               '  ,  dataSource.getWaitSecondsHighCount()
Reference: http://middlewaremagic.com/weblogic/?page_id=8252

WLSDM Dashboard Usage Tutorial
Q: How to monitor WebLogic Managed Server(s), Data Sources, Deployments, JMS Servers?
A: WLSDM has below inbox smart dashboards with ALERT/CLEAR alarm setups:
- WebLogic Managed Server(s)
- Data Sources
- Deployments
- JMS Server(s)
- Garbage Collection
Reference: https://wlsdm.com/docs/document-index
"why weblogic console slow"
"weblogic elk elastic search integration; use WLSDM instead, it is easier"
"weblogic logstash"
"weblogic auto start java flight recorder"
"weblogic backend threads analyzing" "weblogic deadlock detection"
connect('weblogic','weblogic','t3://localhost:7001')
cd ('AppDeployments')
myapps=cmo.getAppDeployments()

for appName in myapps:
       domainConfig()
       cd ('/AppDeployments/'+appName.getName()+'/Targets')
       mytargets = ls(returnMap='true')
       domainRuntime()
       cd('AppRuntimeStateRuntime')
       cd('AppRuntimeStateRuntime')
       for targetinst in mytargets:
             curstate4=cmo.getCurrentState(appName.getName(),targetinst)
             print '-----------', curstate4, '-----------', appName.getName()
Reference: http://middlewaremagic.com/weblogic/?page_id=8252
Health Monitoring and Health Dashboard
Q: How to monitor Oracle WebLogic Server health and states?
A: WLSDM has health dashboard and you are able to monitor every detail about WebLogic health details:
- WebLogic Server Health
- WebLogic Server States
- Health/State ALERT and CLEAR emails
- Data Source Health/State
- Deployments Health/State
- JMS Server Health/States
Reference: https://wlsdm.com/docs/document-index
"weblogic gc time"
"weblogic gc analyze"
"weblogic log view and parse weblogic logs with rotation stdout and stderr"
"weblogic server states running overloaded failed wlst script to monitor ServerRuntime()"
"weblogic slowness" "weblogic stuck failure"
print '#############################################################################'
print '#'
print '# @author wlsdm.com, All Rights Reserved.'
print '#'
print '#############################################################################'

connect('weblogic', 'welcome1', 't3://localhost:7001')

domainRuntime()

cd('ServerRuntimes')

serverRuntimes=ls(returnMap='true')

for serverRuntime in serverRuntimes:
	cd('/ServerRuntimes/' + serverRuntime)
	print '****************************************'
	print 'Server Name: ' + cmo.getName()
	print 'OpenSocketsCurrentCount: ' + String.valueOf(cmo.getOpenSocketsCurrentCount())
	print 'SocketsOpenedTotalCount: ' + String.valueOf(cmo.getSocketsOpenedTotalCount())
Reference: https://wlsdm.com
WLSDM Dashboard Usage Tutorial
Q: How to monitor WebLogic Managed Server(s), Data Sources, Deployments, JMS Servers?
A: WLSDM has below inbox smart dashboards with ALERT/CLEAR alarm setups:
- WebLogic Managed Server(s)
- Data Sources
- Deployments
- JMS Server(s)
- Garbage Collection
Reference: https://wlsdm.com/docs/document-index
Download Latest WLSDM for WebLogic 11g, 12c and 14c
- Latest Version: v4.1.2 Watch WLSDM Trailer
- Quick Installation Guide: Available in ZIP package as README.html
- Online Documentation: Available in ZIP package as WLSDM-HELP.html
Try it for FREE!
Download Latest WL-OPC for WLSDM
- Latest Version: v1.9.2 Watch WL-OPC Trailer
- Quick Installation Guide: Available in ZIP package as README
- Online Documentation: Available in ZIP package as WL-OPC-HELP.html
Customers


WebLogic Community References
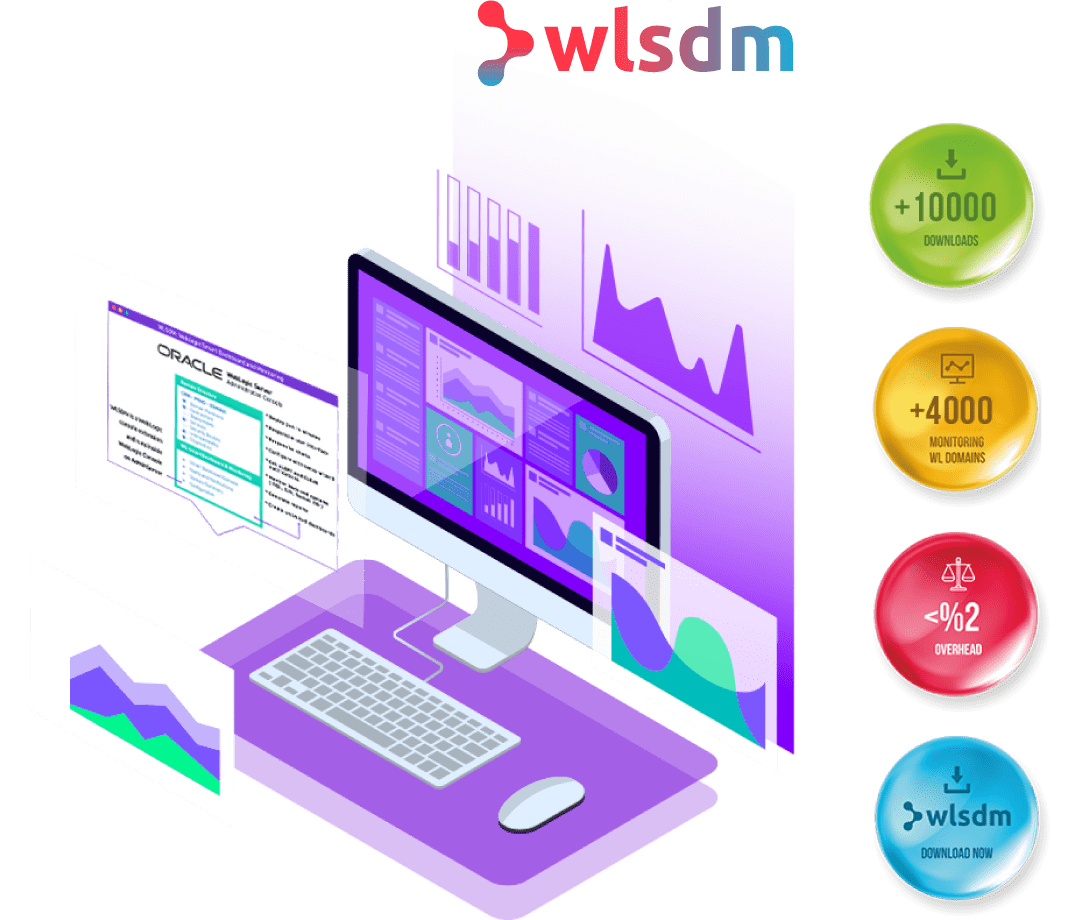
10000+ Downloads... Monitors more than 4000+ WebLogic domains.
Take advantage of WLSDM and increase your service quality now!
Your WLSDM experience = Zero Downtime and Continuous Best Performance
Increase your WebLogic and FMW domain performance then deliver L1/L2 operational excellence.
…ISVs, Fortune 500 companies use WLSDM.
Best, easiest and strongest way to create a success story in your company.
Read Emerson Electric Co.'s success story here!
