Native WebLogic Monitoring
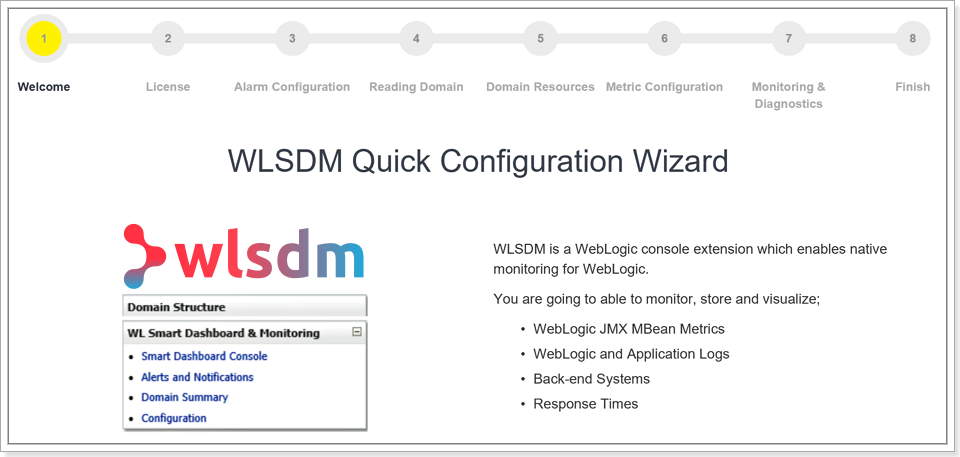
WLSDM is an enterprise "WebLogic console extension" which enables monitoring for WebLogic JMX MBean metrics and all the WebLogic domain assets (Health, Servers, Applications, Data Sources, JMS… etc.). It is very easy to create alarm and notification definitions by using WLSDM metric browser. WLSDM can store any WebLogic metric value historically and also can generate graphical reports.

WLSDM: Key Features
No additional server, database, memory, CPU and operational cost is required!
Our Customers are Our Partners
Did you know that WLSDM serves to many countries around the world? Check out our “Fortune 100” customers then join us. We keep investing in Research & Development to provide the best quality services to our customers. As Volthread, we provide industry-independent services by focusing on monitoring Production systems, improving and enhancing their performance.


Important WLSDM Features
By using WLSDM you can monitor your mission-critical WebLogic domains in any device. Mobile phones, Computers, TV Screens… Project to a TV screen, then let WLSDM take care of remaining. All the WLSDM capabilities can control easily via smart mobile phones.
Our clients project WLSDM Health Dashboard page to their Level-1 data center TVs.


- JDBC Statement Execute (SQLs)
- EJB Business Method Invoke
- Webservices JAXWS Endpoint
- Servlets
- Socket I/O (Outbound HTTP Endpoints)
- File I/O
- ...

- JVM Thread Dump (Stack Trace)
- Heap (Memory) Dump
- WLDF Diagnostic Image
- Java Flight Recorder (JFR)
Fire user-defined scripts by triggering WLSDM custom actions feature!

- WLSDM able to get thread dumps when HOGGER or STUCK threads occurs
- Use Thread Dump Viewer and visualize stack traces
- Open thread dumps by using Thread Dump Analyzer
- Search stack traces on Thread Dump Analyzer page

- Connect to WebLogic WLST Console via WLST Web Console
- Centralize and store WLST Scripts on WLSDM
- Run WLST Scripts on "WLST Web Console" Page real fast
- Autocomplete feature for WLST commands while typing on WLST Web Console
- Add any kind of script then schedule it. Add "Quartz Cron Jobs" and visualize WebLogic CRON operations
- Add Downtime job and stop all WLSDM monitoring or notifications for the specified date/time interval automatically
- WebLogic Health and State History
- WebLogic Managed Server(s), Deployments, Data Sources and JMS Health and State Monitoring & Dashboard
- WebLogic Managed Server(s), Deployments, Data Sources and JMS JMX MBean Metric Monitoring & Dashboard
- Unlimited User-Defined JMX Metric Monitoring & Dashboard
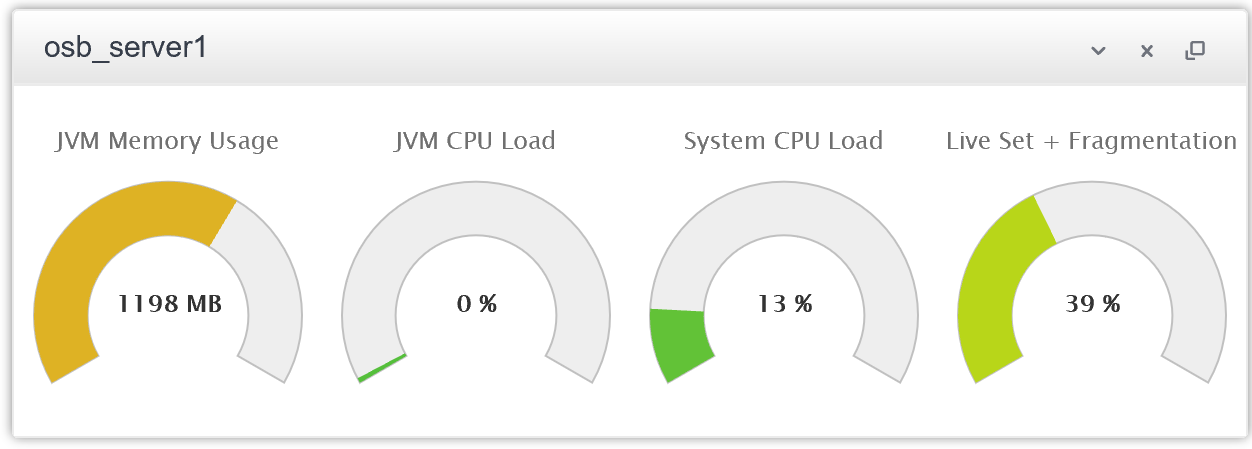
- JVM System Resources Monitoring: Heap, CPU
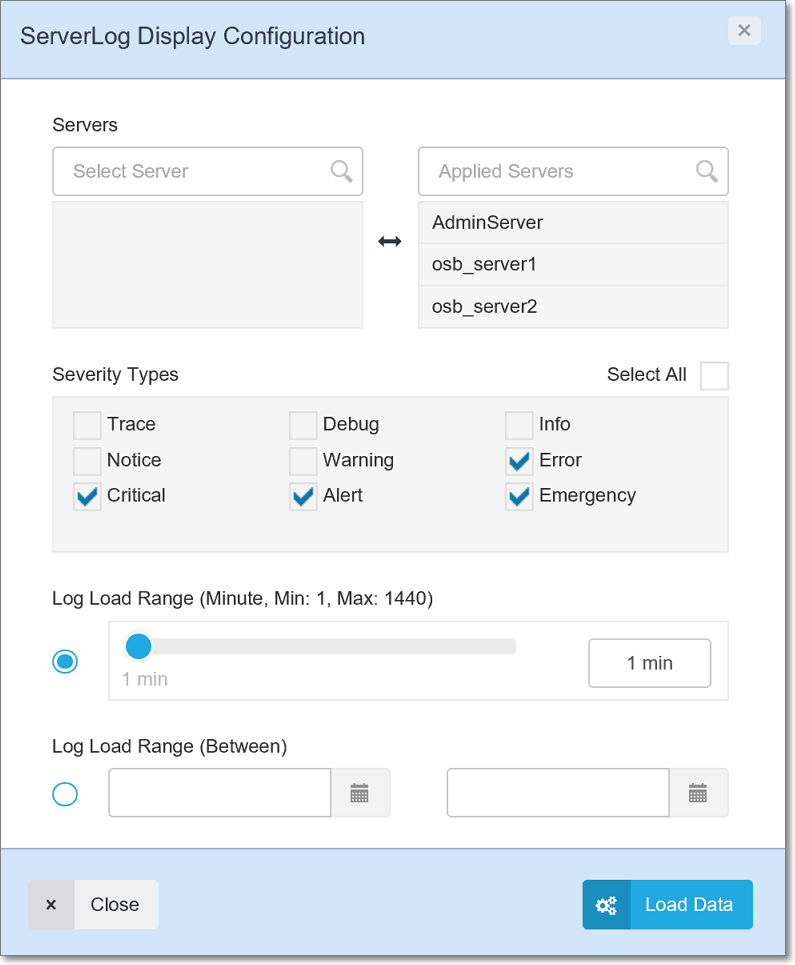
- Log Monitoring & Notifications
- Response Time Monitoring & Notifications
- Back-end Systems Dashboard, Monitoring & Notifications
- Profiling Dumps
- User-Defined JMX Metric Actions
- Metric Reports
- Back-end System Reports
- Log Viewer & Tailer
- WLST Web Console
- Thread Dump Analyzer
- Decrypt & Encrypt Tool
- WebLogic Domain Overview (Summary)
- Domain Time-out Values Summary
- JMX Metric Browser
- JMX MBean Search
- Email (SMTP) and Trap (SNMP) Notification Support
- Customizable HTML Email Templates
- Automated Data Archiving
- Independent/Standalone Admin Server Monitoring

Functional and Easy Usage
- Add metric monitoring by using WLSDM metric browser
- Enable monitoring and storing data
- Specify threshold values for the metrics
- Monitor values on dashboards with fancy graphs
- Get ALERT and CLEAR notifications instantly
- Access historical data and generate reports
JMX Metric MBean Value Database
- Visualize all JMX MBeans objects
- Get historical reports
- Add threshold and actions to JMX MBeans
SMTP and SNMP Support
- One-click SMTP activation
- One-click SNMP activation
- L1 and L2 operation teams notification separation
- User/Group management for notification recipients
- One-click enable/disable notifications
We have built Native and responsive WebLogic monitoring application.
HEALTH Dashboard and Monitoring
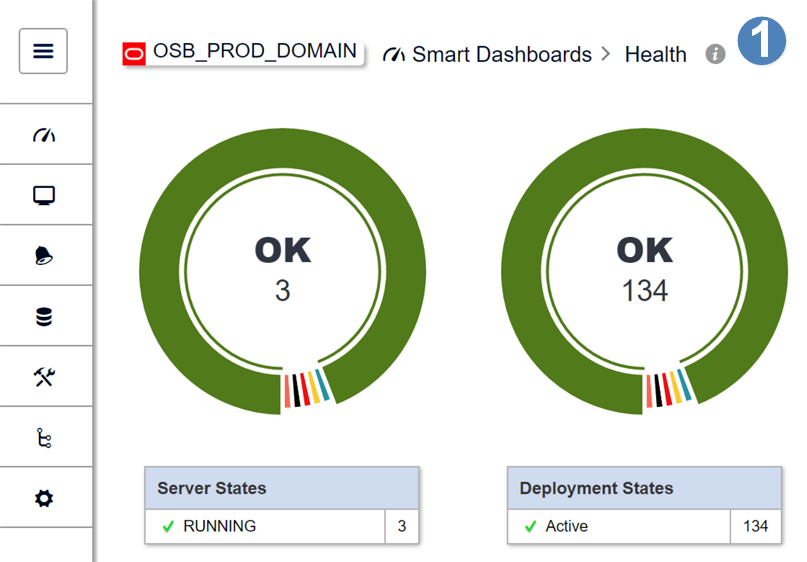
Health dashboard page is the home page of WLSDM and lists all the WebLogic domain resources at one page. All the states and health values are listed for per WebLogic server instance.
Historical Data: Store WebLogic MBean Metrics

WLSDM can store your application's or WebLogic domain’s MBean metrics data historically. It is very easy to see old alarms and metric data. For this feature, WLSDM does not require any 3rd party database installation requirement.
WLSDM can store any WebLogic metric values historically and also can generate graphical reports.
Monitor Application Response Times
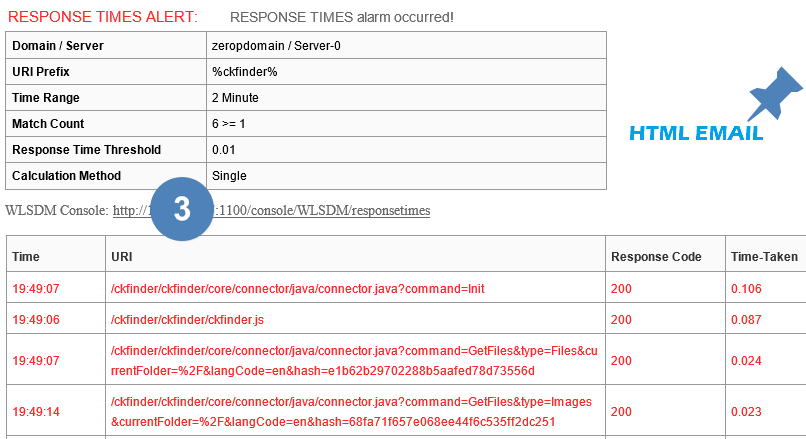
WLSDM can monitor application response times for each WebLogic managed server. It's possible to enable threshold for the URIs and generate alarms. WLSDM calculates average response times for the relevant URI and generates alarms. You can also view and search WebLogic access logs on WLSDM console.
It is always hard to find out slow pages. If you enable response times monitoring for a specific URI, WLSDM will notify you according to the threshold value and dumps Java Flight Recorder (JFR). Anymore it’s the easy part to diagnose the root cause of slowness problem by using Java Mission Control (JMC).
Monitor and Visualize WebLogic MBean Metrics

Just configure JMX metric value thresholds according to your WebLogic domains, then WLSDM generates ALERT and CLEAR notifications. WLSDM has a robust alarm mechanism that has counter, clear, alert... mechanisms.
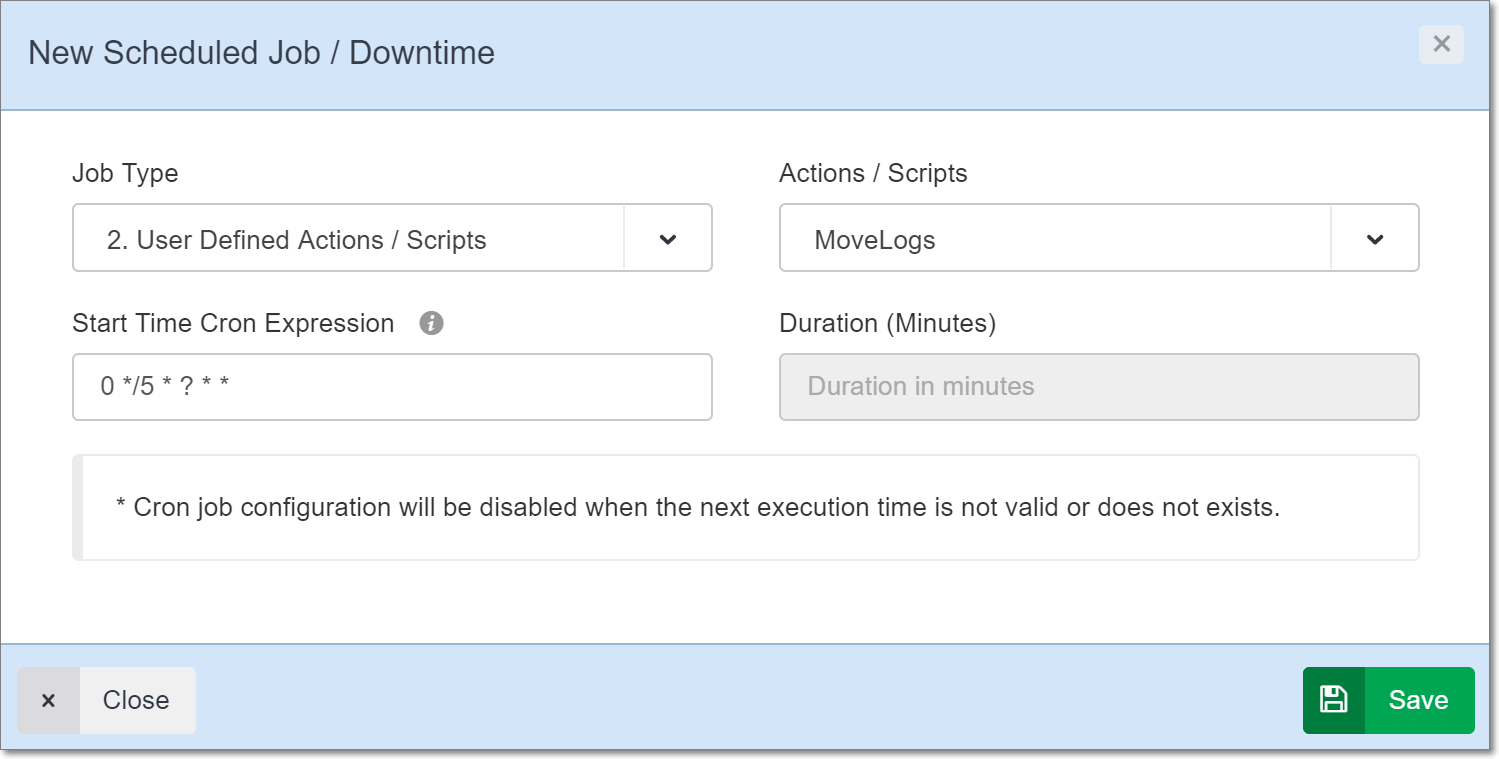
Scheduler Module
Schedule User-Defined Scripts and Downtime
- Add any kind of script then schedule it. Add "Quartz Cron Jobs" and visualize WebLogic CRON operations
- Add Downtime job and stop all WLSDM monitoring or notifications for the specified date/time interval automatically
WLSDM Actions

When something goes wrong, WLSDM collects important dump data for future investigation. These actions are,
- JVM thread dump (.log File)
- JVM heap dump (.hprof File)
- Java Flight Recorder (JFR) (.jfr File)
- WebLogic Diagnostic Framework (WLDF) Image (.zip File)
Download and View Profiling Dumps

All the dump files taken by WLSDM are listed on "Dumps" page under Monitoring & Performance category Thread dump analyzing is always the tough part of the performance issues. Make it easy by using WLSDM "Thread Dump Viewer and Analyzer" module.
It is very easy to create notifications and actions by using WLSDM metric browser.
WLSDM SOA-Suite Module

- WLSDM SOA Monitoring, Diagnostics & Report Modules
- SOA Smart Dashboards
- Monitoring BPEL Engine (Only 11g)
- BPEL Engine Dashboard (Historical – Only 11g)
- Monitoring Composite Performance
- Monitoring Callback and Invoke
- Monitoring Composite Faults
- Monitoring Deployed Composites Trend
- Summarizing Composite List & Endpoint URIs
- SOA Notifications and Alarms
- BPEL Engine Notifications
- Composite Performance Notifications
- Callback and Invoke (DLV_MESSAGE) Notifications
- Composite Faults and Errors Notifications
- SOA Reports
- Reporting SOA BPEL Engine
- Reporting SOA Composite Performance
- Reporting SOA Callback and Invoke (DLV_MESSAGE)
- Reporting SOA Composite Faults and Errors
- SOA Daily Reports (EMAIL)
- Daily SOA Report for Composite Performance
- Daily SOA Report for Callback and Invoke (DLV_MESSAGE)
- Daily SOA Report for Composite Faults and Errors
- Daily SOA Report for Deployed Composites Trend
- SOA Smart Dashboards
WLSDM OSB Module

- WLSDM OSB Monitoring, Diagnostics & Report Modules
- OSB Smart Dashboards
- ProxyService Performance
- Deployed OSB Services Trend
- Service List & Endpoint URIs
- OSB Notifications and Alarms
- ProxyService Performance Notifications
- OSB Daily Reports (EMAIL)
- Daily OSB Report for ProxyService Performance
- Daily OSB Report for Deployed Services Trend
- OSB Smart Dashboards
Download Latest WLSDM for WebLogic 11g, 12c and 14c
- Latest Version: v4.1.2 Watch WLSDM Trailer
- Quick Installation Guide: Available in ZIP package as README.html
- Online Documentation: Available in ZIP package as WLSDM-HELP.html
Try it for FREE!
Download Latest WL-OPC for WLSDM
- Latest Version: v1.9.2 Watch WL-OPC Trailer
- Quick Installation Guide: Available in ZIP package as README
- Online Documentation: Available in ZIP package as WL-OPC-HELP.html
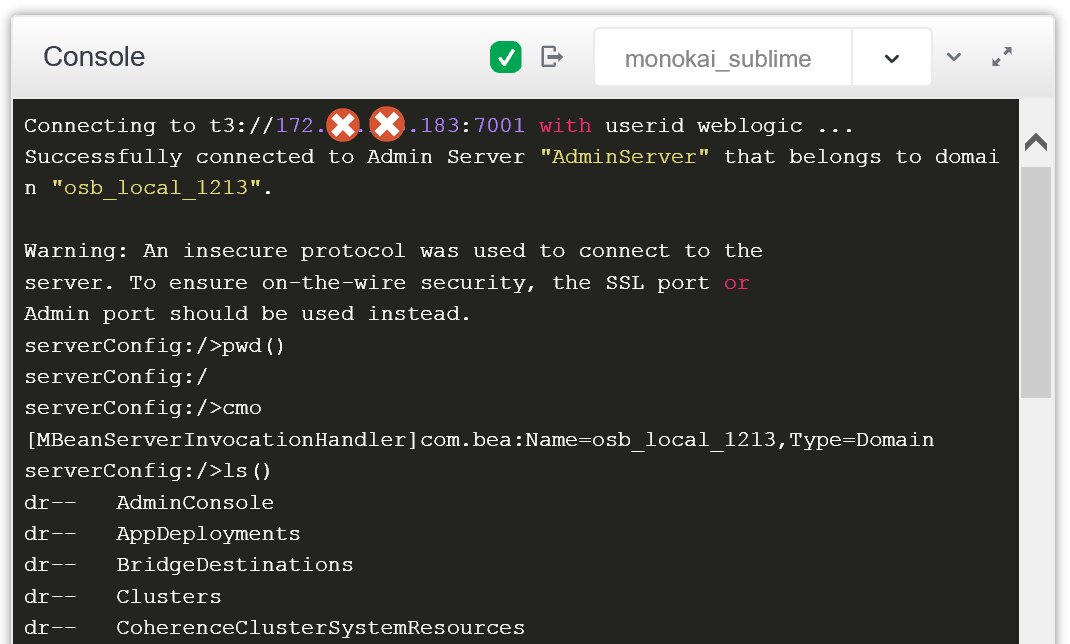
WLSDM is really a cool Monitoring Dashboard, which is worth having a look... Under the Section Operational Tools & Utils you can find various helpful stuff like Log File Viewer, Thread Dump Analyzer, MBean Search, Decrypt -Encrypt and so on. My personal favorite is the WLST Web Console, here you can execute directly from your web browser WLST commands or execute WLST Python Scripts.

Dirk Nachbar
Oracle ACE, Senior Consultant, Trivadis AG
Easy installation and configuration of thresholds and alerts for the essential metrics. File system historical data store, not available otherwise without products like EM Grid/Cloud Control. Integrated with the WebLogic administration console, modern and responsive interface.

Radu Dobrinescu
Senior Partner Solutions Architect CEE at Amazon Web Services (AWS)
I have designed this product not only for plain Oracle WebLogic domains, also supporting and understanding all Oracle Fusion Middleware domains and doing well on production environments. Oracle Service Bus module and dashboards, SOA Suite module and dashboards, FMW Component dashboards… etc. only available in WLSDM and OPC products.

Fevzi Korkutata
Oracle ACE, CTO, Volthread Technology
We have been able to increase our server uptime and stability by efficiently troubleshooting the issue root causes using WLSDM's diagnostic and monitoring features. Rather than reacting to platform-based issues, our team has become more proactive in detecting them early and fixing them before our customers can. The product support is excellent and unmatched.

Soumya Prakash Mishra
Founder & CEO, Intellinez Systems
Installation is easy. It's nice that WLSDM does not have license for Developer servers. Install it on a DEV server to try other features, too. Comparing to WebLogic monitoring dashboard, WLSDM UI looks better! Decryption of data source passwords is nice.

Christos Vezalis
Oracle FMW Implementation Specialist, Nodalpoint Systems
We have been using WLSDM since the last quarter of 2020. As a developer WLSDM is one of our best friend while supporting production middleware operations. Very functional and really easy to use.
Ozkan Capa
Software Development Manager, OYAK
I have more than 2 years of experience with this tool. This tool monitors WebLogic server to really deep level. Best part is its really easy to install and upgrade. Minimal system requirements for installation.Customized view is really helpful. For WebLogic monitoring, my recommendations are WLSDM.
Ramanpreet Ahluwalia
Senior Consultant, Oracle
Great tool. Helping us to monitor our Oracle Fusion Middleware (FMW) domains and providing insightful data.

Shivender Sharma
Oracle Fusion Middleware Administrator, Emerson
I like the feature HTTPClient Outbound Call is something which will help us a lot. Because, we had been working with a lot of third party URLs where we have to connect. Sometimes there is an issue and it is really difficult to find out root cause. I think this tool is going to help us a lot. Great tool!
Madhvi Partiya
Sr. Oracle Fusion Middleware Administrator, Emerson
Before coming across this product, my day to day tasks of managing WebLogic servers and Oracle applications such as OSB and SOA was tedious, manual and inefficient. After starting to use WLSDM, I got a platform in which I could follow my Oracle services' clusters much more efficiently. By using it's features my customer satisfaction increased significantly.
M. Hussain Yousuf
DevOps Administrator
After downloading WLSDM solution. Literally in two clicks we get a tool already suitable for work with a set of threshold values and the ability to send messages and large speedometers of charts. Especially for a large monitoring infrastructure, or to help a DevOps engineer who needs to keep his finger on the pulse of spinning applications.

Yuriy Ponomarev
OBIEE Support, habr.com
I tried lots of different products to monitor our WebLogic domains. WLSDM is the only one which covers all our needs.
Arda Duman
Customer Care Senior Expert Engineer, Nokia
Installation and integration of WLSDM can be done very quickly and easily. Very useful tool for WebLogic.

Rafael Poslednik Marques
Middleware Specialist, Lojas Riachuelo S/A
Nice tool. Making WebLogic administration easier for none experienced users and offering additional services.

Nasreddine Selmi
Middleware Production Engineer, Coface
I did the WLSDM installation in less than 5 minutes in my Oracle BPM domain parallel watching a movie on Netflix. That simple it is.
Govindan Padmanaban
Oracle ACE, General Motors
It helped us to consolidate various alerts generated in the domains of the data bus. Therefore, making our team able to obtain quicker the root cause of the incident in the production environment.

Angel Moron Altamirano
Operation Manager, Telefonica
I learn new things on WLSDM tool for WebLogic. It is great news that WLSDM comes with Oracle SOA Support.
Nagendra Reddy
Senior Software Engineer
Problem solved by the support team, due to using the OUD for access, a base version was made! I congratulate the WLSDM team for their attention and timely solution.
Christhian Gavioli Correa
Middleware Analyst, Telefonica
Hi, I was able to run and configure WLSDM smoothly. Thank you very much for the excellent and swift work!

Valerio Cesolani
Database Administrator, Italy
WLSDM has helped us to produce finer analysis about the concurrent problems that we are faced with in the production environment for the data bus we manage and the WebLogic servers of the application. The result; WLSDM has helped us to reduce troubleshooting time in turn increasing work productivity.
Operation Manager, Telefonica
It helped us to consolidate various alerts generated in the domains of the data bus. Therefore, making our team able to obtain quicker the root cause of the incident in the production environment.
Operation Manager, Telefonica
10000+ Downloads... Monitors more than 4000+
WebLogic domains.
Take advantage of WLSDM and increase your service quality now!
Your WLSDM experience = Zero Downtime and Continuous Best
Performance
Increase your WebLogic and FMW domain performance then deliver L1/L2 operational
excellence.
…ISVs, Fortune 500 companies use WLSDM.
Best, easiest and strongest way to create a success story in your company.
Read Emerson
Electric Co.'s success story here!
Customers


Our Products = Our Reference
Get Enterprise Support and Meet Our Solutions!
Would you like to get enterprise support, training or consulting from our expert team who have developed first and only commercial extension to Oracle WebLogic Server?
Our products are used by global Fortune-500 companies and organizations. We are ready to support you and your company with our Emerson reference. Emerson is one of the biggest energy company "Emerson Electric Co. (USA)" in the world.
Please contact to us about "Oracle WebLogic Server or Java Application Servers Operational Support and Consulting", "JavaSE / JavaEE / JakartaEE Consulting or Project/Module Implementation".
Check our services and subject matter expert consulting portfolio and reach us now! Let’s work together to create your success story.
Services and Consulting
- Oracle WebLogic Server, Apache Tomcat, IBM WebSphere, Red Hat JBoss, Microsoft IIS Expertise
- Manage Service for Application Operations and Management (L1/L2 Application Servers and Web Servers)
- Enterprise Architecture and Integration
- Middleware and Service Oriented Architecture
- Software and Product Development, Custom Enterprise Software Project Implementation
- Datacenter or Cloud Application Infrastructure Migrations
- Application Operations and Infrastructure Operations Support
- L1/L2 Operational Remote Support and Outsourcing.
- Modernization of Legacy Software Applications (Re-Development or Re-Designing)
- Oracle WebLogic and FMW Products Upgrade Projects
- Boutique Training (Oracle WebLogic, JBoss EAP, DevOps, SOA, Middleware and Java)
WLSDM product and brand is owned by Volthread Technology ©
https://www.volthread.com
![]()
Our Customers are Our Partners
Did you know that WLSDM serves to many countries around the world? Check out our “Fortune 100” customers then join us. We keep investing in Research & Development to provide the best quality services to our customers. As Volthread, we provide industry-independent services by focusing on monitoring Production systems, improving and enhancing their performance.


 |
|