WLSDM ReadMe
v4.1.2 | Released on 2025.04.11I. License
The license agreement (EULA) can be found on the wlsdm-license.txt page which is located in the "lic" folder
II. Getting Started
WLSDM for Oracle WebLogic is developed for the best WebLogic developers and administrators to support mission-critical high available domains to complete operational excellence of middleware application support teams. WLSDM supports all plain Oracle WebLogic domains and Oracle Fusion Middleware (FMW) WebLogic domains such as Oracle ADF, SOA Suite, Oracle Service Bus (OSB), Business Intelligence (OBIEE), E-Business Suite (EBS), Oracle Utilities Application Framework (OUAF)... etc. Before installing WLSDM;
Applying multiple "-javaagent" to the same WebLogic Managed Server can cause performance problem for other APM tools. WLSDM's "-javaagent" (wlsdm_agent.jar) for WebLogic Managed Server is able to work together with any other existing APM Java agent at the same WebLogic JVM runtime. wlsdm_agent.jar can be work with other APM tool's Java agent at the same time. Because WLSDM injects nothing to the runtime code and uses out of box JDK capabilities instead. So, WLSDM overhead is negligible and offers the least overhead comparing other APM tools
WLSDM completes missing Oracle WebLogic troubleshooting and administration features of your current installed APM tool. WLSDM is designed and developed to work together with any APM tool at the same time. If there is already an APM tool installed on your environment then extend Oracle WebLogic console with WLSDM to complete the missing part
Fast Troubleshooting
Continuous Performance Monitoring
Easy and Standard Middleware Administration
Automation of Oracle FMW and Oracle WebLogic Operations
Easy Troubleshooting and Fast Root Cause Detection
Offers a Standard Middleware Management for the Team Members
Easy Know-How Transfer in Between L1 and L2 Teams
User Defined JMX DevOps MBeans and Custom Actions
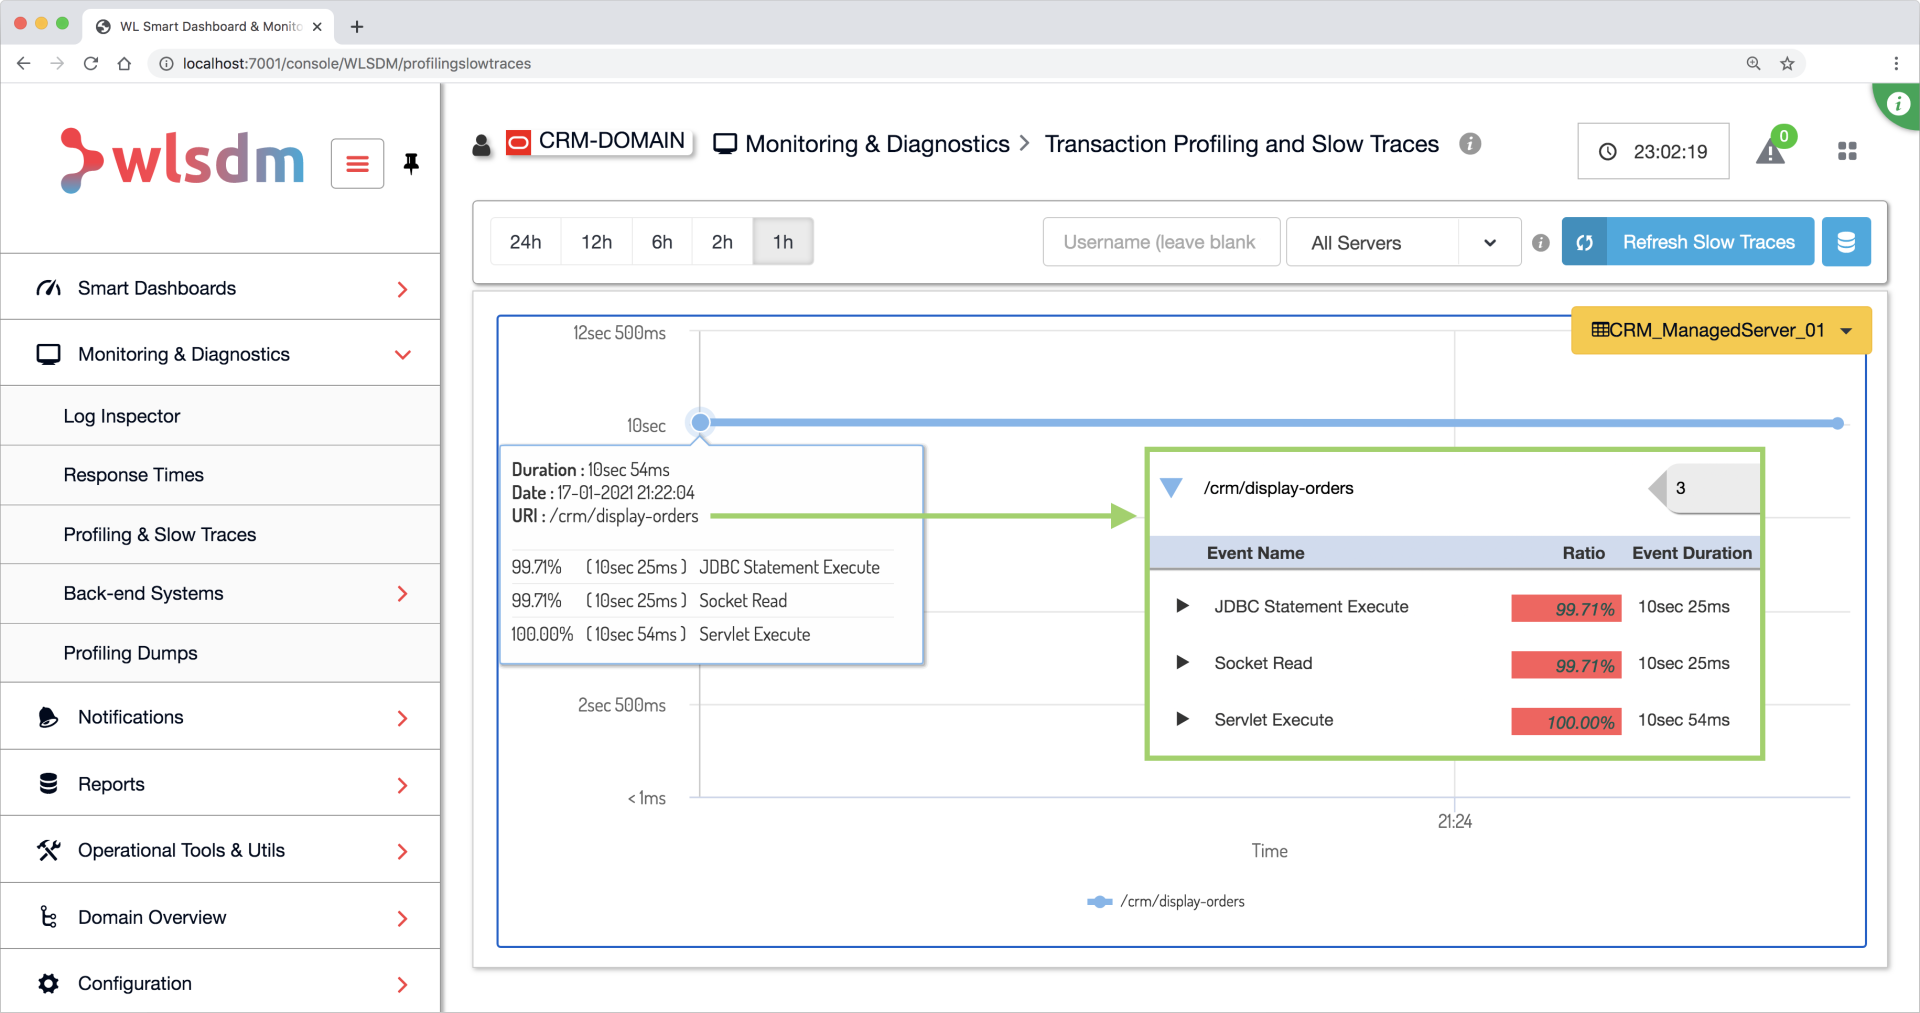
Slow Trace and Transaction Profiling
Advanced Backend Monitoring
- Detect Slow JDBC SQL Statements
- Detect Slow EJB Business Methods
- Detect Slow File and Socket I/O Events
- Detect Slow Outbound (3rd Party) Producer Services
Unmatched WebLogic Operational Utils and Tools
- Web-Based Log Viewer & Tailer
- Web-Based File Explorer: Download and Upload Files
- WLST Web Console
- Decrypt/Encrypt WebLogic Passwords
- Schedule and Visualise CRON Jobs
- Thread Dump Analyzer
III. Supported Oracle FMW Products
- WLSDM completes below Oracle Fusion Middleware (FMW) products with the best and lightest monitoring infrastructure
- WLSDM is the only product that understands Oracle WebLogic FMW domain troubleshooting and offers the best tools for WebLogic Developers and Administrators
- Supports 11g, 12c and 14c compatible Oracle WebLogic and Oracle FMW versions
| Oracle ADF | |
| Oracle SOA Suite | |
| Oracle BPM Suite | |
| Oracle Service Bus (OSB) | |
| Oracle Business Intelligence (OBIEE, BI Publisher) | |
| Oracle Coherence | |
| Oracle Data Integrator (ODI) | |
| Oracle Data Service Integrator | |
| Oracle Forms and Reports | |
| Oracle Identity Management (IDM) | |
| Oracle Access Manager (OAM) | |
| Oracle Virtual Directory (OVD) | |
| Oracle Unified Directory | |
| Oracle Internet Directory (OID) | |
| Oracle WebCenter | |
| Oracle HTTP Server (OHS) | |
| Oracle Traffic Director (OTD) | |
| Oracle Primavera P6 | |
| Oracle Utilities Application Framework (OUAF) | |
| Oracle Customer Care and Billing (CC&B) | |
| Oracle Utilities Meter Data Management (MDM) | |
| Oracle Utilities Customer to Meter (C2M) |
IV. Package Directory Layout
$wlsdm_package.zip file contains the following directories and files:
| war | contains wlsdm.war which is the main installation file and WebLogic Smart Dashboard & Monitoring Console |
| jar | contains wlsdm_agent.jar file which is the WLSDM agent for the operational actions. Must be added to the server's JVM arguments |
| docs | contains the help documents for WLSDM |
| lic | contains license information files. wlsdm-license.html and other 3rd party license information files |
V. Prerequisites
- WebLogic Developer or Administrator
- Mission-Critical HA WebLogic Domain(s)
- SMTP/Mail server information and SMTP relay for the server that WebLogic Administration Server is running. Highly recommended!
WLSDM improves administrative and DevOps WebLogic knowledge and skills
Use " / info" icons for MBean explanations and descriptions on WLSDM console
WLSDM Solution Requires:
- NO additional physical servers (machine)
- NO additional database
- NO additional CPU, memory
- NO additional operational cost... etc.
WLSDM uses existing resources with the least overhead
VI. Installation
Easy installation!
- Add
wlsdm_agent.jarto Managed Server's JVM Arguments*${JAVA_OPTIONS} - Copy
wlsdm.warfile to WebLogic domain'sconsole-extfolder or deploywlsdm.warfor Oracle WebLogic 14.1.2 and later - (Re)start WebLogic Administration Server and Managed Server(s)
- That's all! WLSDM console will deploy automatically
- Login to WLSDM Console then complete configuration wizard once
- Start proactive monitoring and move forward WebLogic operations!
WLSDM Installation Best Practice Architecture

Quick Step by Step Installation Guide [ for WebLogic Server 14c (14.1.2+) ]
For WebLogic Server 14.1.2 and Later
1. upload or copy $wlsdm_package/jar/wlsdm_agent.jar to /path/to/wlsdm_agent.jar on the Managed Server machine(s)[user@host]:$ mkdir ${WL_DOMAIN_HOME}/wlsdm_agent [user@host]:$ cp $wlsdm_package/jar/wlsdm_agent.jar ${WL_DOMAIN_HOME}/wlsdm_agent/wlsdm_agent.jar
2. add wlsdm_agent.jar to WebLogic Managed Server´s JVM Arguments as below: *${JAVA_OPTIONS}wlsdm_agent.jar can be work with other APM tool´s Java agent at the same time2.1. JDK 17.0.12+ or JDK 21.0.4+: Add the following WLSDM and JFR JVM arguments to WebLogic Managed Server(s)
Consider the above best practice architecture and add wlsdm_agent.jar for the chosen WebLogic Managed Server(s)
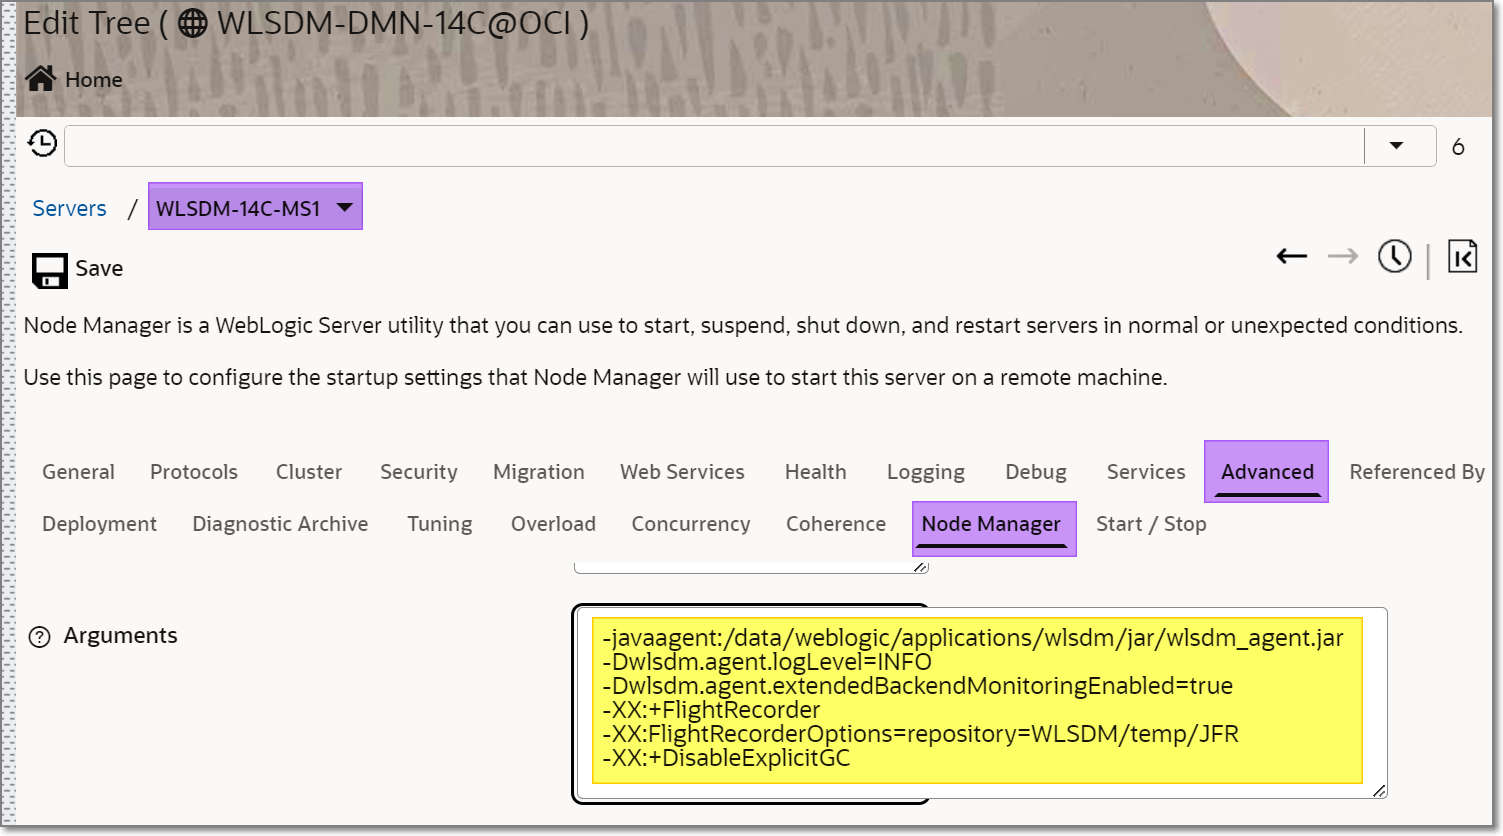
Choose below appropriate $JAVA_OPTIONS according to your Oracle WebLogic Server environment. Replace "/path/to" with absolute folder path and keep "WLSDM/temp/JFR" as a relative path!-javaagent:/path/to/wlsdm_agent.jar -Dwlsdm.agent.logLevel=INFO -Dwlsdm.agent.extendedBackendMonitoringEnabled=true -XX:+FlightRecorder -XX:FlightRecorderOptions=repository=WLSDM/temp/JFR -XX:+DisableExplicitGCfor a more advanced installation, refer to the "additional JVM arguments (*1)" and be aware of the "known issues (*2)" sections below
How to add WLSDM JVM Parameters to WebLogic Managed Server arguments? (If you know how to add JVM arguments to WebLogic then skip to step 3) with WebLogic Remote Console: login to WebLogic remote console, navigate to "Edit Tree > Environment > Servers > (select the Managed Server) > Advanced > Node Manager > Arguments" add the above JVM entry to the Arguments section and save the page. use the screen capture below as a visual reference.
"Edit Tree > Environment > Servers > (select the Managed Server) > Advanced > Node Manager > Arguments"
3. (re)start WebLogic Managed Server(s) which wlsdm_agent.jar is installed. after restarting the Managed Server(s), below logs must be seen in WebLogic Managed Server log files. this means WLSDM agent is deployed successfully WebLogic Managed Server Log:<Mar 4, 2025 1:13:24 PM PDT> <Info> <WLSDM> <BEA-000000> <WLSDM agent loaded successfully. Version: v4.1.2> <Mar 4, 2025 1:13:24 PM PDT> <Info> <WLSDM> <BEA-000000> <RJVM operation is bound in the registry with the name wlsdm_agent_remote_operation.>
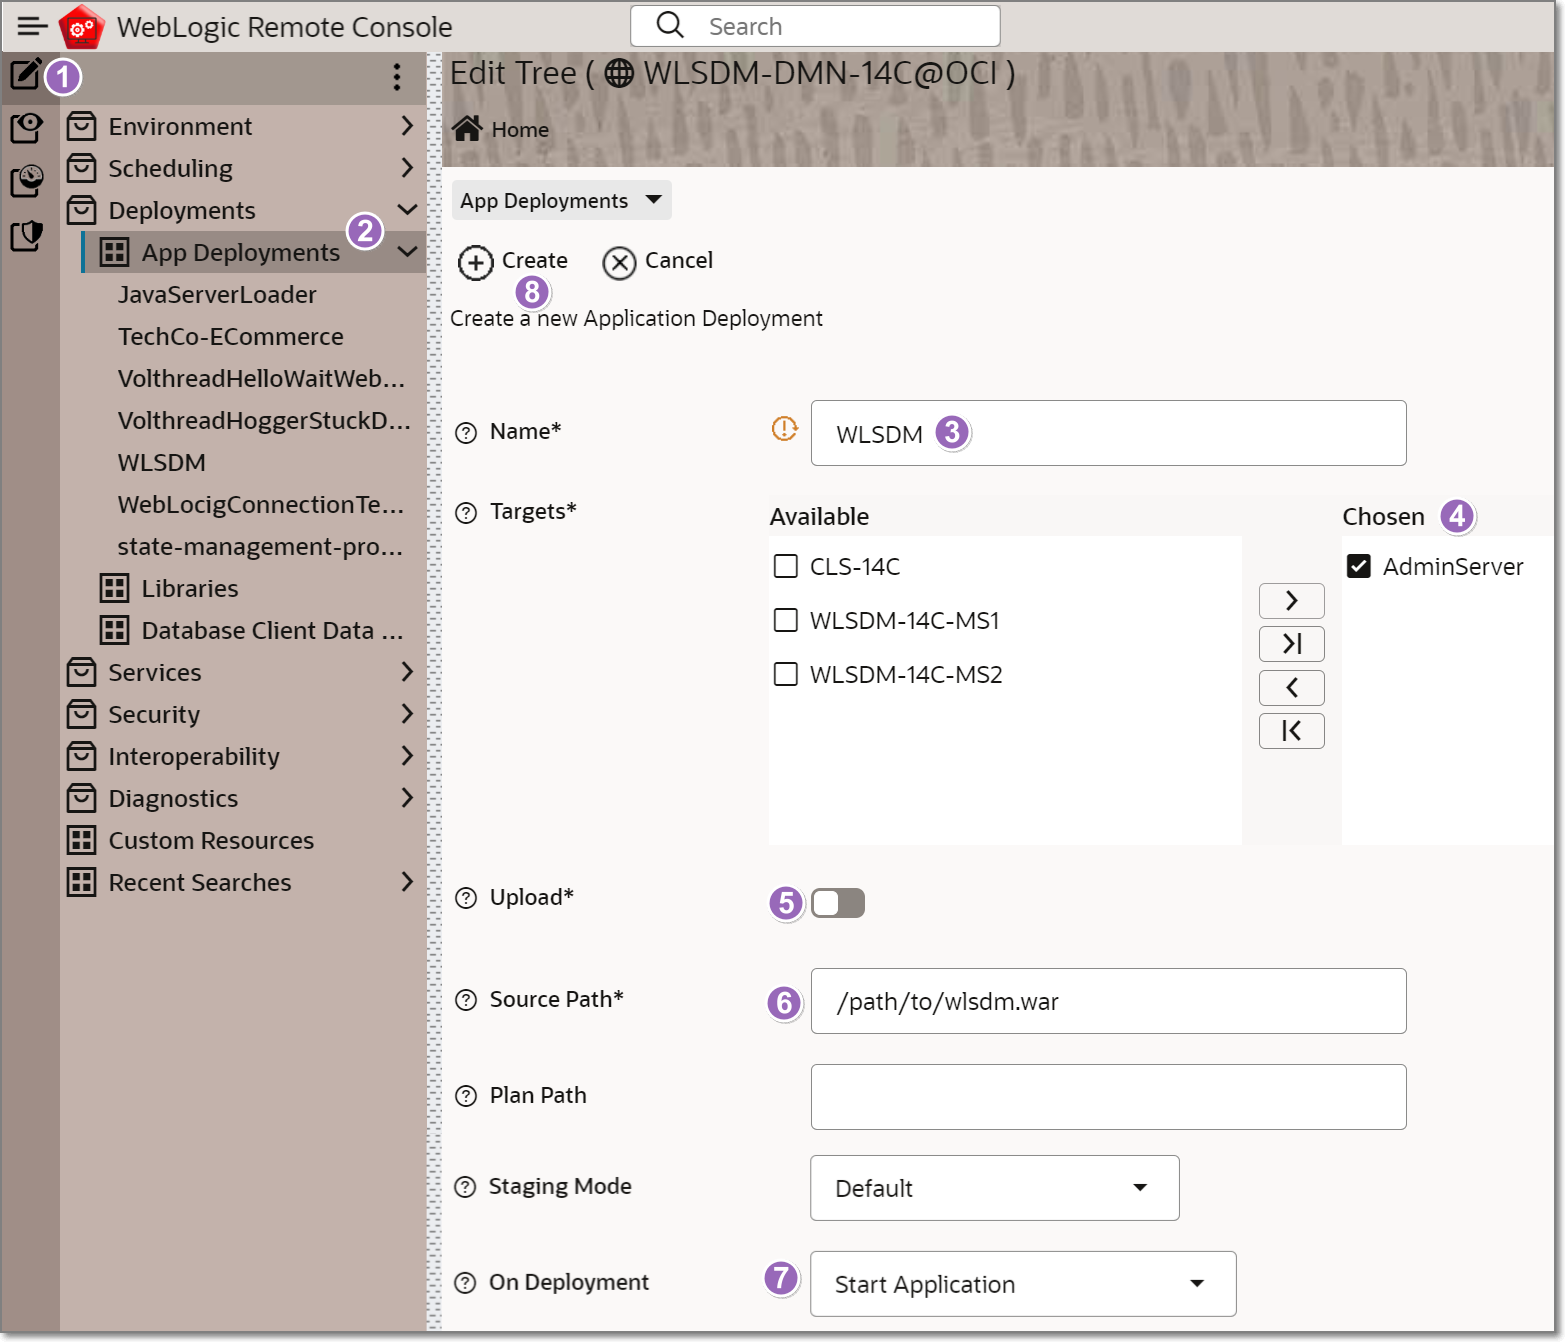
4. upload or copy $wlsdm_package/war/wlsdm.war to /path/to/wlsdm.war on the Administration Server machine
5. deploy wlsdm.war application to the Administration Server. It can be done through "WebLogic Remote Console" or WLST command; 5.1. via WebLogic Remote Console: use the screen capture below as a visual reference, and follow the numbered steps accordingly
5.2. via WLST Command: *Make sure to replace parameters, environment variables, username, and password with the correct values for your environment[user@host]:$ export WLST_PROPERTIES="-Dweblogic.RootDirectory=/path/to/${WL_DOMAIN_HOME} -Dweblogic.security.TrustKeyStore=DemoTrust -Dweblogic.security.SSL.ignoreHostnameVerification=true" [user@host]:$ java -Dweblogic.security.SSL.ignoreHostnameVerification=true -cp ${WL_HOME}/server/lib/weblogic.jar weblogic.Deployer -adminurl t3s://$ADMIN_SERVER_IP:$PORT -username weblogic -password Welcome1 -deploy -name WLSDM -targets AdminServer -source /path/to/wlsdm.war -debugbelow logs must be seen in WebLogic Admin Server log files. this means WLSDM console is deployed successfully and WLSDM console is ready to monitor WebLogic domain
WebLogic Admin Server Log:<Mar 4, 2025 1:12:12 PM PDT> <Info> <WLSDM> <BEA-000000> <WLSDM console deployed successfully. Version: v4.1.2> <Mar 4, 2025 1:12:12 PM PDT> <Info> <WLSDM> <BEA-000000> <WLSDM garbage collection monitoring initialized successfully.> <Mar 4, 2025 1:12:12 PM PDT> <Info> <WLSDM> <BEA-000000> <WLSDM metric monitoring initialized successfully.> <Mar 4, 2025 1:12:12 PM PDT> <Info> <WLSDM> <BEA-000000> <WLSDM health monitoring initialized successfully.> <Mar 4, 2025 1:12:12 PM PDT> <Info> <WLSDM> <BEA-000000> <WLSDM performance monitoring initialized successfully.> <Mar 4, 2025 1:12:12 PM PDT> <Info> <WLSDM> <BEA-000000> <WLSDM back-end monitoring initialized successfully.> <Mar 4, 2025 1:12:12 PM PDT> <Info> <WLSDM> <BEA-000000> <WLSDM data archiver initialized successfully.> <Mar 4, 2025 1:12:12 PM PDT> <Info> <WLSDM> <BEA-000000> <WLSDM custom DevOps MBean handler initialized successfully.> <Mar 4, 2025 1:12:12 PM PDT> <Info> <WLSDM> <BEA-000000> <WLSDM job scheduler initialized successfully.>
6. make sure all the WebLogic domain resources (wl servers, deployments, data sources, JMS servers... etc.) are RUNNING and ACTIVE
7. access WLSDM console: How to access WLSDM console?
8. complete WLSDM quick configuration wizard carefully according to the WebLogic domain characteristic: How to complete WLSDM wizard?
Quick Step by Step Installation Guide [ for WebLogic Server 11g, 12c, 14c (14.1.1) ]
For WebLogic Server 14.1.1 and Earlier
 1.  upload or copy $wlsdm_package/jar/wlsdm_agent.jar to /path/to/wlsdm_agent.jar on the Managed Server machine(s)
                            [user@host]:$ mkdir ${WL_DOMAIN_HOME}/wlsdm_agent
[user@host]:$ cp $wlsdm_package/jar/wlsdm_agent.jar ${WL_DOMAIN_HOME}/wlsdm_agent/wlsdm_agent.jar
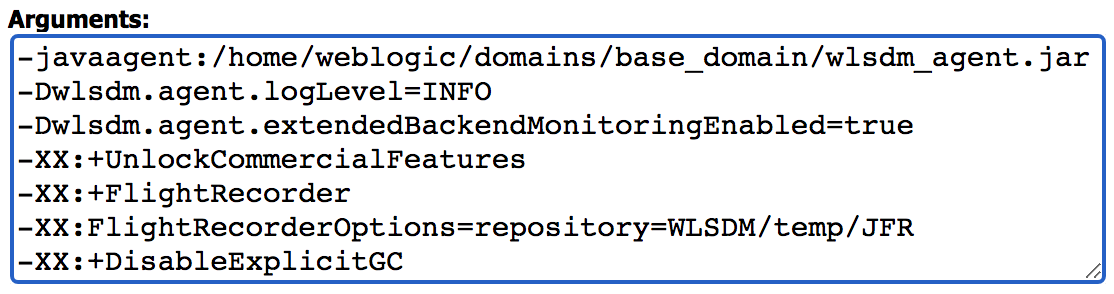
2. add wlsdm_agent.jar to WebLogic Managed Server´s JVM Arguments as below: *${JAVA_OPTIONS}wlsdm_agent.jar can be work with other APM tool´s Java agent at the same time2.1. JDK 11 or JDK 1.8 or JDK 1.7.0_40+ (Latest): Add the following WLSDM and JFR JVM arguments to WebLogic Managed Server(s)
Consider the above best practice architecture and add wlsdm_agent.jar for the chosen WebLogic Managed Server(s)
Choose below appropriate $JAVA_OPTIONS according to your Oracle WebLogic Server environment. Replace "/path/to" with absolute folder path and keep "WLSDM/temp/JFR" as a relative path!-javaagent:/path/to/wlsdm_agent.jar -Dwlsdm.agent.logLevel=INFO -Dwlsdm.agent.extendedBackendMonitoringEnabled=true -XX:+UnlockCommercialFeatures -XX:+FlightRecorder -XX:FlightRecorderOptions=repository=WLSDM/temp/JFR -XX:+DisableExplicitGC2.2. JDK 1.7.0_40 Lower or JDK 1.6 (Legacy, Backporting Compatibility): Add the following WLSDM JVM arguments to WebLogic Managed Server(s)-javaagent:/path/to/wlsdm_agent.jar -Dwlsdm.agent.logLevel=INFO -Dwlsdm.agent.extendedBackendMonitoringEnabled=true -XX:+DisableExplicitGC2.3. JRockit (Legacy, Backporting Compatibility): Add the following WLSDM and JFR JVM arguments to WebLogic Managed Server(s)-javaagent:/path/to/wlsdm_agent.jar -Dwlsdm.agent.logLevel=INFO -Dwlsdm.agent.extendedBackendMonitoringEnabled=true -XX:FlightRecorderOptions=repository=WLSDM/temp/JFR -XX:+DisableExplicitGCfor a more advanced installation, refer to the "additional JVM arguments (*1)" and be aware of the "known issues (*2)" sections below
how to add WLSDM JVM Parameters to WebLogic Managed Server arguments? (If you know how to add JVM arguments to WebLogic then skip to step 3) a) with WebLogic NodeManager: from the administration console, navigate to "Environments > Servers > (select the Managed Server) > Server Start > Arguments" add the above suitable JVM entry to the Arguments section and save the page
Environments > Servers > (select the Managed Server) > Server Start > Arguments
b) Without WebLogic NodeManager: add the following entry (add before Java executes) to the "startManagedServer" file UNIX / LINUX / MAC OS X:"startManagedServer.sh"export JAVA_OPTIONS="$JAVA_OPTIONS -javaagent:/path/to/wlsdm_agent.jar -Dwlsdm.agent.logLevel=INFO -Dwlsdm.agent.extendedBackendMonitoringEnabled=true -XX:+UnlockCommercialFeatures -XX:+FlightRecorder -XX:FlightRecorderOptions=repository=WLSDM/temp/JFR -XX:+DisableExplicitGC"WINDOWS:"startManagedServer.cmd"set JAVA_OPTIONS=%JAVA_OPTIONS% -javaagent:"C:\path\to\wlsdm_agent.jar" -Dwlsdm.agent.logLevel=INFO -Dwlsdm.agent.extendedBackendMonitoringEnabled=true -XX:+UnlockCommercialFeatures -XX:+FlightRecorder -XX:FlightRecorderOptions=repository=WLSDM/temp/JFR -XX:+DisableExplicitGCNOTE: do not install "wlsdm_agent.jar" to the WebLogic Administration Server!
3. (re)start WebLogic Managed Server(s) which wlsdm_agent.jar is installed. after restarting the Managed Server(s), below logs must be seen in WebLogic Managed Server log files. this means WLSDM agent is deployed successfully WebLogic Managed Server Log:<Mar 4, 2025 1:13:24 PM PDT> <Info> <WLSDM> <BEA-000000> <WLSDM agent loaded successfully. Version: v4.1.2> <Mar 4, 2025 1:13:24 PM PDT> <Info> <WLSDM> <BEA-000000> <RJVM operation is bound in the registry with the name wlsdm_agent_remote_operation.>
4. upload or copy $wlsdm_package/war/wlsdm.war to ${WL_DOMAIN_HOME}/console-ext/. folder on the Administration Server machine
5. then (re)start WebLogic Administration Server. that is all, WLSDM console will deploy automatically after restarting Administration Server, below logs must be seen in WebLogic Admin Server log files. this means WLSDM console is deployed successfully and WLSDM console is ready to monitor WebLogic domain WebLogic Admin Server Log:<Mar 4, 2025 1:12:12 PM PDT> <Info> <WLSDM> <BEA-000000> <WLSDM console deployed successfully. Version: v4.1.2> <Mar 4, 2025 1:12:12 PM PDT> <Info> <WLSDM> <BEA-000000> <WLSDM garbage collection monitoring initialized successfully.> <Mar 4, 2025 1:12:12 PM PDT> <Info> <WLSDM> <BEA-000000> <WLSDM metric monitoring initialized successfully.> <Mar 4, 2025 1:12:12 PM PDT> <Info> <WLSDM> <BEA-000000> <WLSDM health monitoring initialized successfully.> <Mar 4, 2025 1:12:12 PM PDT> <Info> <WLSDM> <BEA-000000> <WLSDM performance monitoring initialized successfully.> <Mar 4, 2025 1:12:12 PM PDT> <Info> <WLSDM> <BEA-000000> <WLSDM back-end monitoring initialized successfully.> <Mar 4, 2025 1:12:12 PM PDT> <Info> <WLSDM> <BEA-000000> <WLSDM data archiver initialized successfully.> <Mar 4, 2025 1:12:12 PM PDT> <Info> <WLSDM> <BEA-000000> <WLSDM custom DevOps MBean handler initialized successfully.> <Mar 4, 2025 1:12:12 PM PDT> <Info> <WLSDM> <BEA-000000> <WLSDM job scheduler initialized successfully.>
6. make sure all the WebLogic domain resources (wl servers, deployments, data sources, JMS servers... etc.) are RUNNING and ACTIVE
7. access WLSDM console: How to access WLSDM console?
8. complete WLSDM quick configuration wizard carefully according to the WebLogic domain characteristic: How to complete WLSDM wizard?
*1: Additional WLSDM JVM Arguments (Optional)
WLSDM JVM Argument Description -Dwlsdm.agent.extendedBackendMonitoringEnabled=true Enables additional backend monitoring via bytecode instrumentation. This property is required for enabling the Outbound HTTPClient Call events -Dwlsdm.system.runtimeFolderPath=/path/to/folder Refers to the folder created by WLSDM, default folder path is located at ${WL_DOMAIN_HOME}/WLSDM. This folder contains WLSDM embedded database, various configuration files and data related to WLSDM's monitoring and management functionality -Dwlsdm.system.adminModeDisabled=true Disables data source password encryption feature on "Domain Summary" page and disables "Decrypt/Encrypt Page" completely. Applicable to only Administration Server. Apply to startWebLogic.sh by adding below line:
export JAVA_OPTIONS="${JAVA_OPTIONS} -Dwlsdm.system.adminModeDisabled=true"-Dwlsdm.system.dbShrinkOnStartup=true Enables WLSDM embedded database shrink operation. The shrinking process begins automatically while WebLogic Administration Server is starting when the argument is added to WebLogic start script. Applicable to only Administration Server. Apply to startWebLogic.sh by adding the below line:
export JAVA_OPTIONS="${JAVA_OPTIONS} -Dwlsdm.system.dbShrinkOnStartup=true"
Note: It is important to note that enabling this property might slightly increase the startup time of the server due to the additional operations performed on the database. However, the benefits of reduced disk space usage often outweigh the minimal delay in startup time
*2: Known Issues & Advanced Configuration Notes
WebLogic Administration Server and WLSDM Agent: Do NOT install wlsdm_agent.jar to WebLogic Administration Server. Never add wlsdm_agent.jar JVM arguments to Administration Server startup scripts (startWebLogic.sh or setDomainEnv.sh) otherwise, WLSDM throws ERROR and WebLogic Administration Server fails to start. Or use if statements in the scripts to bypass Administration Server JVM argument assertion. When WebLogic Administration Server fails to start then consider this case and simply remove wlsdm_agent.jar arguments from Administration Server startup scriptAbout DisableExplicitGC JVM Argument: By default calls to System.gc() are enabled (-XX:-DisableExplicitGC). WLSDM uses and recommends -XX:+DisableExplicitGC to disable calls to System.gc() for better RMI performance. Remember, with or without this parameter JVM/WebLogic still performs garbage collection when necessary. This is a useful JVM argument to keep WebLogic Managed Servers GC safe and also can be added to Administration Server. For more information: http://www.oracle.com/technetwork/articles/java/vmoptions-jsp-140102.htmlKnown Issue - DisableExplicitGC: After adding -XX:+DisableExplicitGC argument; consider the custom Java applications deployed to WebLogic Managed Server(s) are not using System.gc() manually. Otherwise, remove the recommended "-XX:+DisableExplicitGC" argumentKnown Issue - WLSMBeanServerBuilder: After the complete WLSDM installation if the "Smart Dashboards > JVM System Resources" page is not working well and does not show the metric values properly then add "-Djavax.management.builder.initial=weblogic.management.jmx.mbeanserver.WLSMBeanServerBuilder" JVM argument to the relevant Managed Server(s) and restart the server(s). In few cases, while connecting to Oracle WebLogic Server Java level MBeans or custom MBeans are not visible on enabling the Platform Server MBean. For more information, Oracle Support Doc ID: 1465052.1Known Issue - Conflict Between DUseSunHttpHandler and Dwlsdm.agent.extendedBackendMonitoringEnabled: When both -DUseSunHttpHandler=true and -Dwlsdm.agent.extendedBackendMonitoringEnabled=true are added to a WebLogic ManagedServer instances simultaneously, an error occurs: "java.lang.NoClassDefFoundError: com/vopm/collector/HTTPData" To resolve this issue, remove one of the conflicting parameters. Consider removing "-DUseSunHttpHandler=true" argument for monitoring remote HTTP(s) outbound connections if it is technically possible
Installation and Introduction Video Tutorial
Installation tutorial contains basic information about WLSDM console usage;
Newest | Installation on Oracle Cloud Infrastructure (OCI) and Console Usage Tutorial, Oracle Enterprise Linux (Same as On-Premise)
WLSDM Installation: On Oracle Cloud Infrastructure (OCI), Oracle PaaS Java Cloud Service (JCS) or On-Premise
VII. Accessing WLSDM Console
For WebLogic Server 14.1.2 and LaterAfter deploying wlsdm.war, log in to the WLSDM Console with default WebLogic security realm username and password. Since WebLogic Administration Console has been removed in 14.1.2, WLSDM now operates independently with its own dedicated login page. It utilizes the default WebLogic security realm, ensuring that existing users, groups, and credentials remain valid for authentication and authorization

Type WLSDM URL on browser's address bar for accessing directly!
http:// $ADMIN_SERVER_IP : $PORT /vconsole/WLSDM
https:// $ADMIN_SERVER_IP : $PORT /vconsole/WLSDM
For WebLogic Server 14.1.1 and Earlier
After the installation, log in to the WebLogic Admin Console; the WLSDM portlet will appear under the WebLogic domain structure
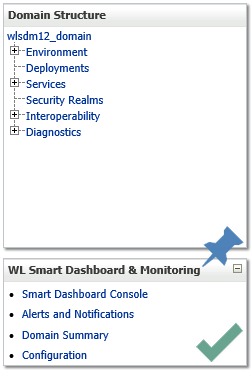
Click "Smart Dashboard Console" on WLSDM menu
OR
Type WLSDM URL on browser's address bar for accessing directly
http:// $ADMIN_SERVER_IP : $PORT /console/WLSDM
https:// $ADMIN_SERVER_IP : $PORT /console/WLSDM
VIII. Console Usage & DevOps MBean
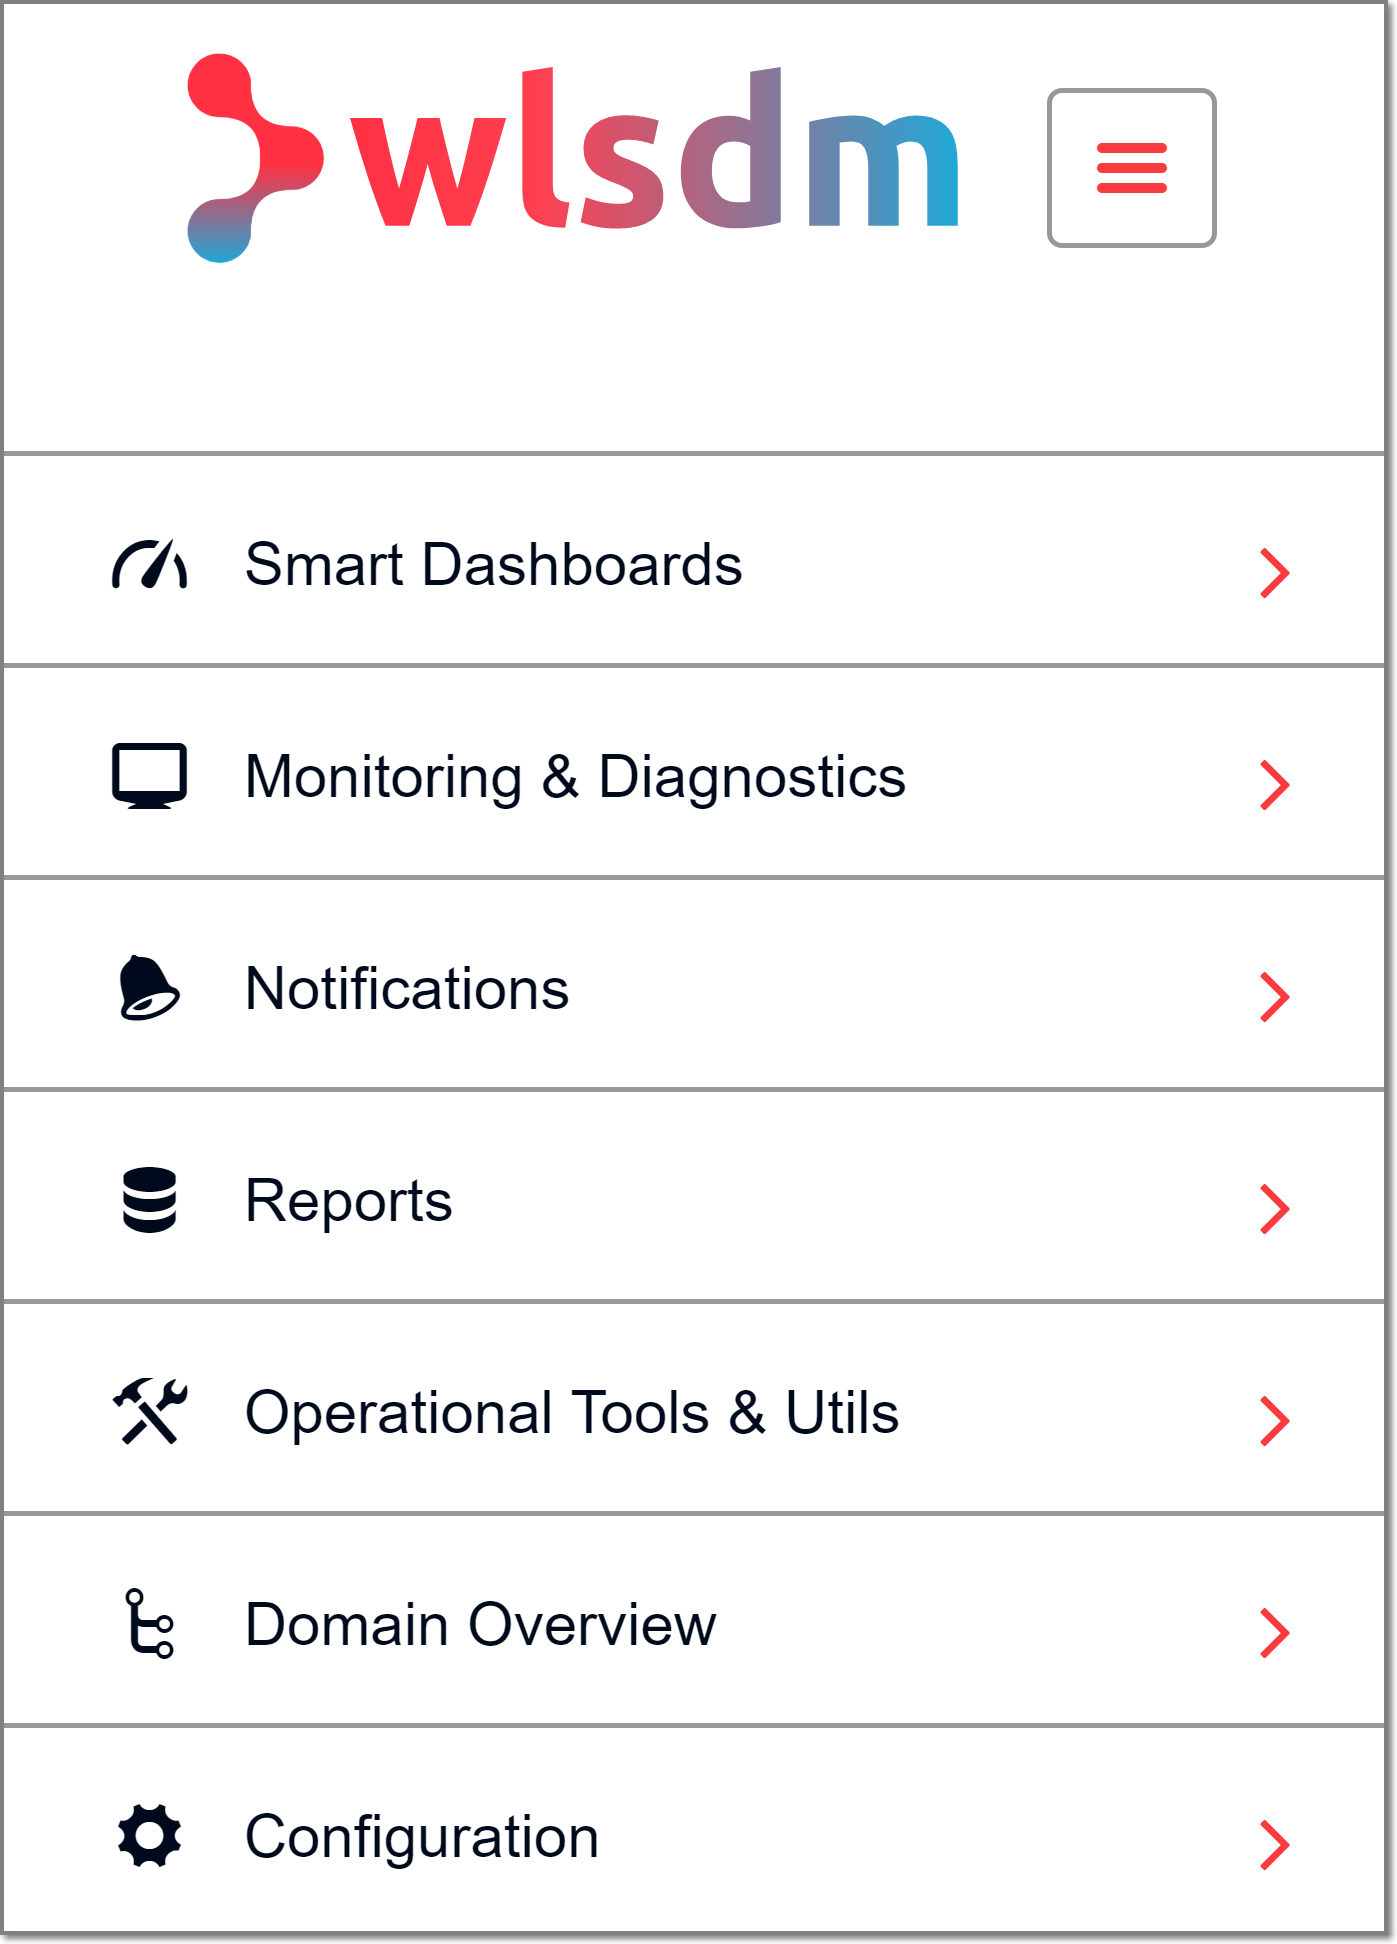
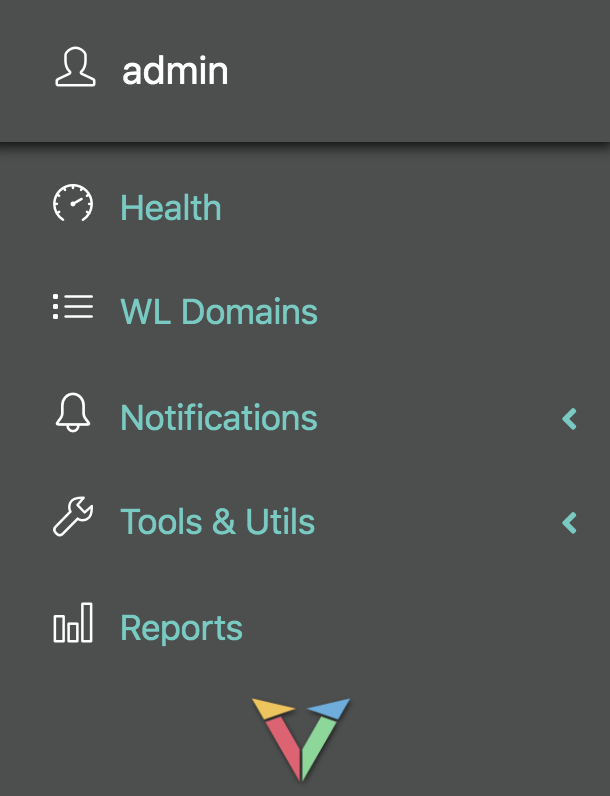
Main WLSDM menu is located on the left side and the default is collapsed. It can be expanded/collapsed by the menu icon
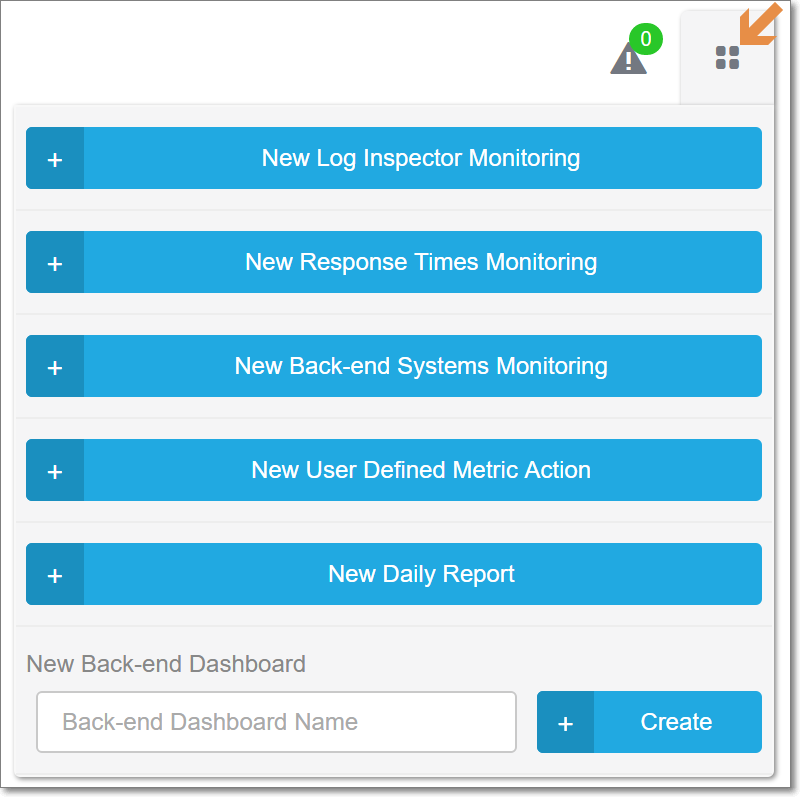
Page operations icon is located on the right top of every page. Visual page settings and page functions can be listed on the page operations menu
WLSDM Console has "Quick Tour" for the first login. WLSDM Console usage is very easy and user friendly. Just follow the "Quick Tour" steps!
Visit all WLSDM default dashboards, pages and discover WLSDM console features. Especially "Operational Tools & Utils" pages will increase interactivity between Administrator/Developer/DevOps and WebLogic Domain. Enjoy your "Native WebLogic Monitoring and Diagnostic" solution
Transform SQL and OS Bash Scripts to JMX MBean Objects
Go to "Add Monitoring > Generic DevOps MBeans (tab)" page
Use Generic DevOps MBean functionality and never miss any detail about the WebLogic domain environment. Export the DevOps scripts and share them with team members. Do not let valuable scripts have been lost in CRON jobs
This feature is named DevOps MBean to increase the interactivity between WebLogic domains and deployed applications. It is possible to monitor i.e. Waiting orders, logged-in user count, 3rd party webservice invocation response times... etc.
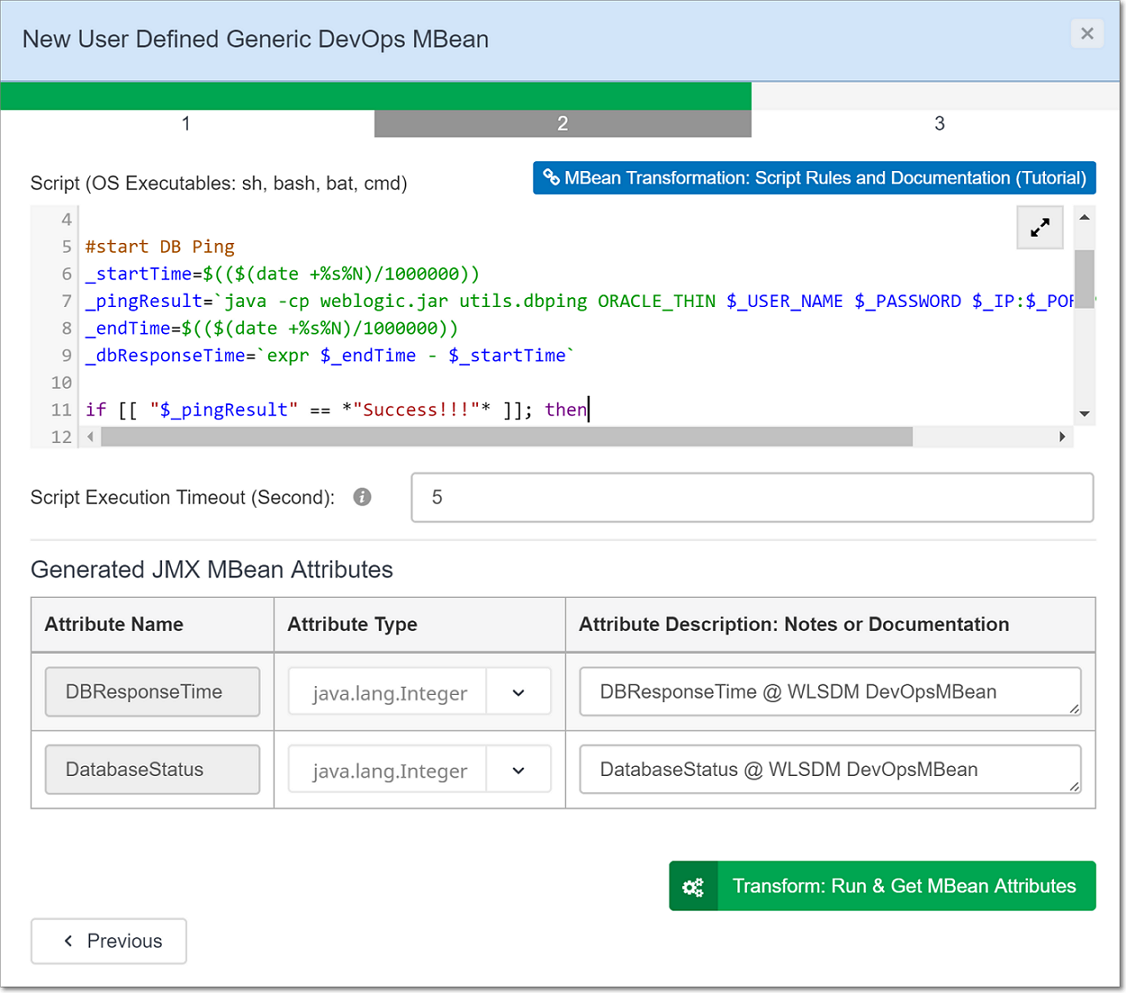
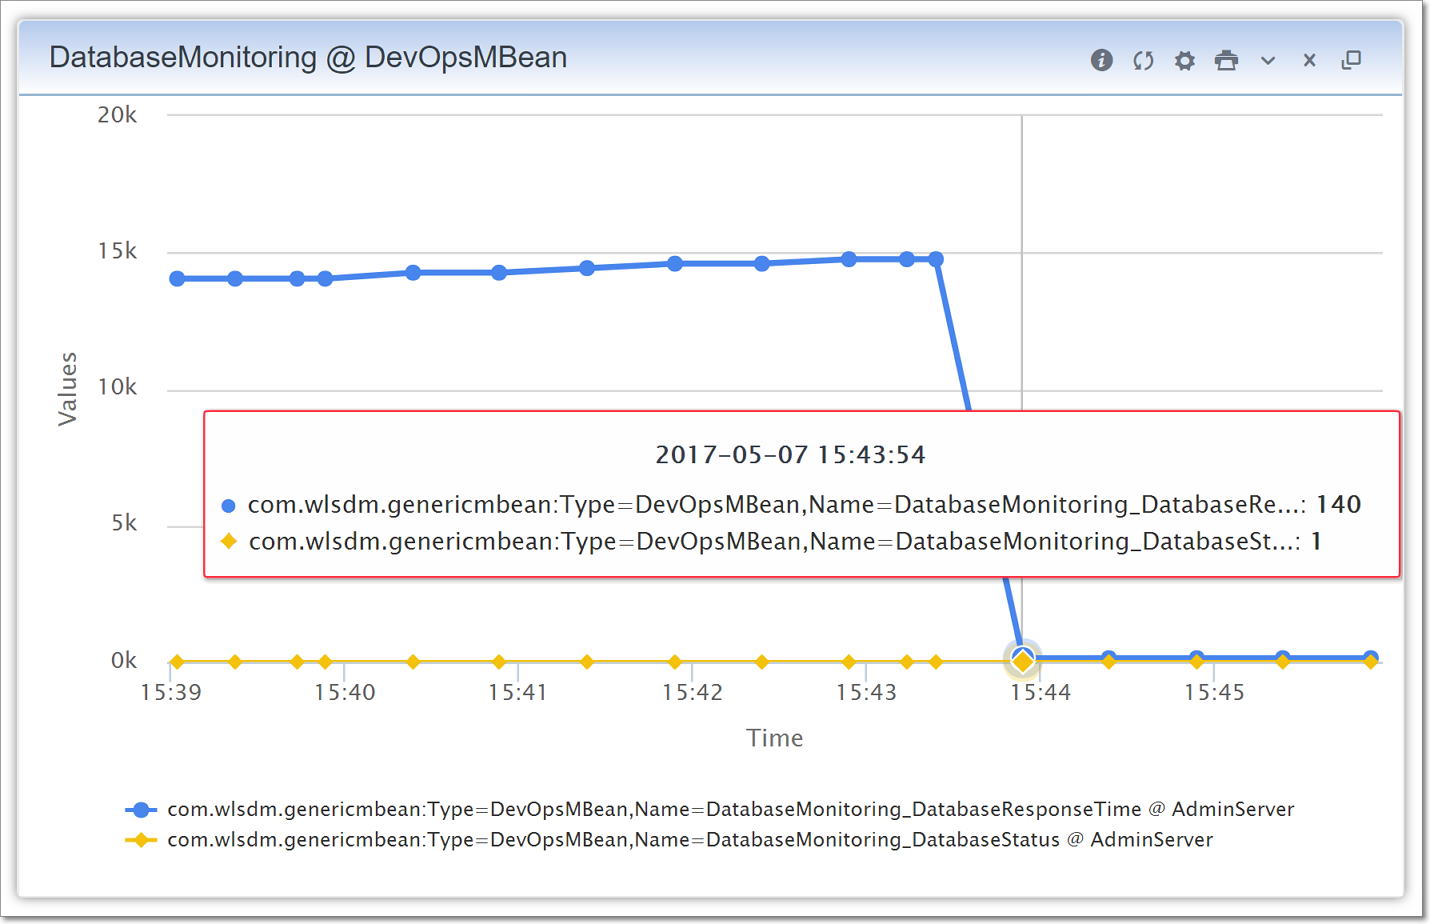
The left screen capture below is the script part and the right screen capture is the Output on the assigned custom dashboard. Generic DevOps MBean feature is totally parametric and supports to define custom actions for the assigned threshold
Step-1 Write Shell Script: Ping database and calculate database response time using WebLogic API (weblogic.jar)
#Author: WLSDM for Oracle WebLogic | wlsdm.com

#Variables
_dbStatus=0
#0:DB_DOWN,1:DB_UP

#start DB Ping
_startTime=$(($(date +%s%N)/1000000))
_pingResult=`java -cp weblogic.jar utils.dbping ORACLE_THIN $YOUR_USER_NAME $YOUR_PASSWORD $YOUR_IP:$YOUR_PORT/$YOUR_SERVICE_NAME`
_endTime=$(($(date +%s%N)/1000000))
_dbResponseTime=`expr $_endTime - $_startTime`

if [[ "$_pingResult" == *"Success!!!"* ]]; then
  _dbStatus=1
  #echo "Database connection SUCCESS!!!"
  #DB_UP
  echo DatabaseStatus=$_dbStatus
else
  _dbStatus=0
  #echo "Database connection FAILURE!!!"
  #DB_DOWN
  echo DatabaseStatus=$_dbStatus
fi
echo DatabaseResponseTime=$_dbResponseTime
Shell Script Output:
DatabaseStatus=1
DatabaseResponseTime=1218
Step-2 Use WLSDM Generic DevOps MBean Wizard
"User Defined Generic DevOps MBean" wizard is available on the "Configuration > Monitoring & Diagnostics" page. List records on "Generic DevOps MBeans" tab and use the "New Generic DevOps MBean" button from the "Page Operations" menu to open the wizard
- More information about WLSDM DevOps MBean is available on the documentation page: Generic DevOps MBean
- SQL MBean Transformation on WebLogic: Screencast
IX. Upgrade & Reinstall & Uninstall
Easy Upgrade!
- Replace the
wlsdm_agent.jarfile with the new release and keep wlsdm_agent.jar JVM arguments.*($JAVA_OPTIONS) - Check the latest installation document and add if any new wlsdm_agent.jar JVM argument available
- Replace
wlsdm.warfile with the new release to WebLogic domain'sconsole-extfolder - (Re)start WebLogic Managed Server(s) then Administration Server
- That's all! WLSDM will be upgraded after restart processes
Fresh Re-Installation!
- Replace the
wlsdm_agent.jarfile with the new release and keep wlsdm_agent.jar JVM arguments.*($JAVA_OPTIONS) - Shutdown Administration Server
- Delete
${WL_DOMAIN_HOME}/WLSDMruntime folder - Replace
wlsdm.warfile with the new release to WebLogic domain'sconsole-extfolder - Start WebLogic Administration Server and restart the Managed Server(s) which
wlsdm_agent.jarinstalled - That's all! WLSDM will be reinstalled after restart processes
- Complete WLSDM configuration wizard
How to Uninstall?
- Remove
wlsdm_agent.jarJVM arguments on Managed Server(s) if it is installed then restart the WebLogic Managed Server(s) - Shutdown Administration Server
- Delete WLSDM runtime folder
${WL_DOMAIN_HOME}/WLSDM/ - Delete wlsdm.war file
${WL_DOMAIN_HOME}/console-ext/wlsdm.warthen start the WebLogic Administration Server
X. Monitoring AdminServer & WL-OPC
WLSDM offers complete monitoring infrastructure for WebLogic Application Server. monitorWLAdmin is a simple "Plug & Play" standalone application for monitoring WebLogic Administration Server externally. After the WLSDM installation and wizard setup completion, standalone monitorWLAdmin application will appear in runtime WLSDM folder as below content
${WL_DOMAIN_HOME}/WLSDM/monitorWLAdmin Folder Contents:
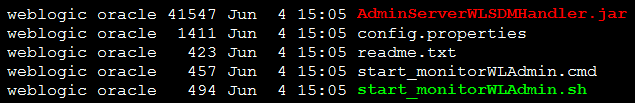
How to start?
Unix/Linux: nohup ./start_monitorWLAdmin.sh &
How does monitorWLAdmin work?
It monitors WebLogic Admin console periodically. When "Administration Server" goes down or slows down monitorWLAdmin sends alarm notification instantly
How to monitor and manage multiple WebLogic domains centrally?
If you have more than 5+ WebLogic domains; then use WL-OPC product for the central WebLogic domain monitoring and management
Monitor, Manage, Organize and Bulk Update: Unlimited Oracle WebLogic & Oracle Fusion Middleware Domains
- Oracle WebLogic FMW Domains Asset Management and Inventory
- Oracle WebLogic AdminServer Monitoring
- Central HEALTH and STATE Monitoring (Servers, Deployments, Data Sources, JMS Resources, FMW Components)
- Consolidated and Central Notification Dashboard (Garbage Collection, JVM Resources, Back-end... etc.)
- Central WLSDM Notification Broadcasting and Notification Rules
- Reporting WebLogic Domain Performance and Availability
- Comparing WebLogic JVM Arguments
- Bulk JVM Argument Manager
- Bulk Data Source Manager
- Bulk Domain Settings Standardizer
WL-OPC and WLSDM Architecture

WL-OPC White Paper: https://wlsdm.com/wl-opc
WL-OPC Download: https://wlsdm.com/download
XI. Documentation & Community
Help is available
- on the "Help" page of WLSDM console at WebLogic domain Help page Console URL:
http(s)://$IP:$PORT/(v)console/WLSDM/consolehelp/index - at HTML page in "$wlsdm_package/docs" directory. Open WLSDM-HELP.html
- online at http://www.wlsdm.com/docs/help
XII. WebLogic Monitoring Tutorials
Installation and Console Usage: Oracle Cloud Infrastructure (OCI), Oracle Java Cloud Service (JCS) or On-PremiseYouTube Tutorial (Newest)
WebLogic Health Monitoring Tutorial (+Voice)
YouTube Tutorial
WebLogic JVM System Resources Dashboard Tutorial (+Voice)
YouTube Tutorial
WebLogic JMX MBean Metric Monitoring (+Voice)
YouTube Tutorial
Advanced WebLogic Monitoring and Automation:
Develop JMX MBeans (YouTube Tutorial, Sample JAVA Code, Documentation)
How to get WebLogic thread dump continuously?
Continuous WebLogic Thread Dump Tutorial
WLSDM Dashboard Usage
YouTube Tutorial
Actions (Thread Dump, Heap Dump, Java Flight Recorder (JFR), WLDF Image)
YouTube Tutorial
JMX MBean Metric Browser & Email Notifications
YouTube Tutorial
Application Response Times & Log Inspector
YouTube Tutorial
How to Monitor Oracle DB ACTIVE/INACTIVE Sessions on WebLogic?
YouTube Tutorial
Monitor Back-end WebService Response Times with CURL on WebLogic:
Generic DevOps MBean: CURL Script, Download DevOps MBean Export, Sample Request
Monitor Every LOG/Text File On WebLogic:
WebLogic Log Monitoring Screencast
XIII. Follow Us
Please follow us and get updates. Never miss a post about Oracle WebLogic and FMW monitoring issues!
Community / Support
![]() Medium Blog
Medium Blog
Twitter Follow
YouTube Subscribe
LinkedIn Connect
Facebook Like
Instagram follow4follow
Email Support Team
XIV. Roadmap
v4.x.x | Planned Features and Improvements for Future WLSDM Releases
|
|
XIV. Change Log & Release Notes
v4.1.2 | Released on 2025.04.11
New WLSDM console login page is accessible via https:// $ADMIN_SERVER_IP : $PORT /vconsole
| v4.1.2 enhances compatibility with Java 17 & 21 and updates the standalone design for Oracle WebLogic Server 14c (14.1.2), featuring a new WLSDM console login page. Existing credentials remain valid. This release also includes minor bug fixes for improved stability | |
| Java 17 and Java 21 support added. WLSDM is now certified with JDK 17.x.x and JDK 21.x.x. | |
| Full compatibility with Oracle WebLogic Server 14c (14.1.2). Since WebLogic Administration Console has been removed in 14.1.2, WLSDM now operates independently with its own dedicated login page. It utilizes the default WebLogic security realm, ensuring that existing users, groups, and credentials remain valid for authentication and authorization | |
| New WLSDM login page available. The WLSDM console is now accessible via: https://$ADMIN_SERVER_IP:$PORT/vconsole | |
| Resolved multiple minor bugs to improve system stability |
v4.1.1 | Released on 2024.05.23
| v4.1.1 is a major update release focused on enhancing monitoring capabilities, improving user experience, and addressing key issues in previous versions. This update includes new features for certificate monitoring, clipboard functionality, custom actions, and several important bug fixes This update ensures better monitoring, improved user interface, and enhanced security features, providing a more reliable and efficient experience for WebLogic administrators and developers | |
| Monitoring Trust JKS Certificates Expire Dates: Added the ability to monitor and alert on expiration dates for Trust JKS certificates | |
| Notification Pages: Consolidated and redesigned WLSDM Notification Pages for a more streamlined user experience | |
| Clipboard Functionality: Implemented clipboard feature for easier data handling within the application | |
| Custom Actions: Added the option to "Add script result to Email" for custom actions, allowing users to include the results of scripts directly in email notifications | |
| FileExplorer: Addressed the issue of not recognizing remote servers within FileExplorer | |
| JFR Profiling: Introduced options for JFR Profiling Dump, providing more control over profiling activities | |
| SOA/OSB Monitoring: Added exception handling configurations for SOA/OSB monitoring, allowing specific exceptions to be defined | |
| Dynamic Managed Server: Fixed an error occurs on the Health Page when a dynamic managed server is added to the domain | |
| Event Attachments: Enabled attachments for events and added the ability to include custom action results in MOW (Management of WebLogic) | |
| Backend Dashboard: Added a close icon to the Backend Dashboard MOW for better usability | |
| Disk Usage: Fixed a critical issue where WLSDM Derby DB crashes when disk usage reaches 100% | |
| WLSDM DevOps MBean: Added an option to re-create or update the WLSDM DevOps MBean | |
| Scheduler: Introduced a feature to send successful output daily via the scheduler | |
| OCI Support: Fixed an issue with license generation based on hostname command output in OCI (Oracle Cloud Infrastructure) environments | |
| Security Realm & Provider: Added monitoring for Security Realm and Provider hosts | |
| Runtime Folder: Added configuration options for the WLSDM runtime folder | |
| Backend Notification Limit: Added a feature to set a notification limit for backend monitoring | |
| JDK 11 Support: Added support for JDK 11 | |
| Profiling Slow Traces: Resolved issues encountered on the Profiling Slow Traces page with Java 11 | |
| SMTP Password: Made the SMTP password field invisible to enhance security | |
| WLSDM DevOps MBean Edit: Added a "Destroy & Recreate" button in the WLSDM DevOps MBean Edit option | |
| Settings Redesign: Redesigned the "Settings > wl-opc.wlsdm" tab for better user experience | |
| Data Source and LDAP Alarms: Included detailed JDBC URL or endpoint information in email content for data source and LDAP alarms | |
| Switched the positions of OPC Register and License Key in the wizard for better usability | |
| The Generic DevOps MBean Callback Target now auto-fills based on user experience feedback | |
| Added pagination to the grid on the Slow Traces page for easier navigation | |
| Included a count for the total number of records on the Slow Traces page | |
| Set the DiskUsage chart and actions as default for better monitoring | |
| Enhanced end-to-end timeout functionality and tuned Derby connections | |
| Fixed an error that occurred when recreating an existing DevOps MBean with the same name | |
| Resolved the warning issue on the JVM Monitoring page | |
| Fixed the issue where long URLs in HTTPClient outbound calls were overflowing outside the box | |
| Enhanced the system for suggesting possible root causes of issues | |
| SSL mail configuration within WLSDM is improved | |
| Facilitated the process of registering WLSDM to WL-OPC on the WLSDM Console | |
| Updated the support email address | |
| Tuned WLSDM memory consumption | |
| Resolved and improved the "Port cannot be NULL" error during WL-OPC registration | |
| Enhanced the issue of re-registering a WLSDM domain to OPC when the WLSDM license has expired | |
| Enhanced WLSDM OSB Report Mail Notifications | |
| Resolved the last calculated date issue in WLSDM OSB Report Mail Notifications | |
| Solved the issue of the WLSDM/services.internal service getting stuck and improved the performance | |
| Enhanced the warning for WLSDM SMTP Username | |
| Updated the WLSDM cronjob schedule time configuration | |
| Improved OSB Smart Dashboards to list services and endpoint URIs more effectively | |
| Fixed the issue where an error occurred when attempting to log in to the WebLogic console with a monitoring user | |
| Resolved the UI bug related to metric and chart options | |
| Fixed the issue where default metric dashboards were not visible after a fresh installation | |
| Addressed the display problem in SystemCPULoad notifications | |
| Fixed the issue related to loading WLSDM licenses | |
| Corrected the diagnostic log monitoring name in WL-OPC | |
| Resolved the error related to the WLSDM database | |
| Fixed the error in WLSDM SOA settings | |
| Addressed the issue related to start time and end time in StuckThread Possible Root Causes | |
| Fixed the issue where SystemCpuLoad PossibleRootCause was not displaying | |
| Resolved the bug related to opening the thread dump analyzer | |
| Fixed the errors related to missing methods and class definitions in WLSDM Java libraries | |
| Corrected the concatenation issue in OSB Smart Dashboard Service List & Endpoint URIs page | |
| Fixed the issue where filtering on the dashboard affected all managed servers in Metric Settings and JMX MBean Browser page | |
| Resolved the issue where top consumer threads data was not appearing | |
| Fixed the error related to Generic DevOps MBean module | |
| Corrected text typo errors in WLSDM log and handled the errors appearing in WLSDM logs | |
| Addressed the display problem related to Backend Monitoring Socket Read Remote Address | |
| Fixed the "Request-URI Too Long" error in WLSDM Wizard | |
| Resolved the duration time bug in JDBC event charts | |
| Addressed the bugs related to OCI (Oracle Cloud Infrastructure) SMTP integration | |
| Fixed the bug related to unparseable numbers in WLSDM | |
| Resolved the bug related to the missing TestDurationInMs attribute | |
| Fixed the mail send problem after completing the wizard | |
| Corrected the default display of JMX MBean store data values | |
| Addressed the bug related to scheduler job emails | |
| Resolved the text box issue in Generic DevOps MBean | |
| Fixed the error related to registering WLSDM with WL-OPC |
v3.9.2 | Released on 2021.03.22
| v3.9.2 is a patch set release | |
| Log Monitoring warning box is improved and redesigned. New "Disable/Enable Log Monitoring Warning" and "Enable Log Monitoring" functionalities and buttons are added, It is more configurable anymore. If this warning is available on WLSDM console consider cleaning and maintaining Oracle WebLogic Server logs for better performance on WebLogic domains | |
| -Dwlsdm.system.dbShrinkOnStartup=true feature is added. WLSDM embedded database shrink operation begins automatically while WebLogic AdminServer is starting when this new argument is added to WebLogic start script | |
| Build number is added to WLSDM version on every page | |
| Username field is more readable on the "Profiling & Slow Traces" page anymore | |
| Warning is added while creating GenericDevOpMBean when a dashboard is not selected | |
| Sorting problem is fixed on CPU notification modal window | |
| wlsdm_agent log file is giving "NULL" when every backend monitoring cycle is completed | |
| Response times possible root cause result and slow trace event details are not consistent | |
| In some cases, minor garbage collection configurations are duplicated | |
| Unable to add WebLogic user as WLSDM administrator problem is fixed | |
| Refresh All Log files problem is fixed on View WLSDM Log page |
v3.9.1 | Released on 2021.01.26
| v3.9.1 is a new feature set release. Extended backend monitoring, easier troubleshooting, detecting slow traces by ECID, OSB module service errors are the new major features | |
| HTTP outbound service monitoring feature is added. Outbound HTTPClient Requests event is added to the backend monitoring module. Requires additional JVM agent argument for the activation: -Dwlsdm.agent.extendedBackendMonitoringEnabled=true | |
| Service Errors page is added to the OSB module. For monitoring OSB service errors on WLSDM, developers or administrators must activate the error reporting per OSB service configuration | |
| Slow Traces page is added. Monitor and report the slow traces and track them via ECID. Anymore analyzing slow transactions is available on WLSDM | |
| DiskUsage MBeans are added by default for the OS mount points. Disk usage percentage can be added on the JMX MBean Browser page | |
| FileExplorer page is enhanced. Permission and privilege support for admin and non-admin users is added. File listing limit is configurable anymore, the default value is 1000. Granting access for protected files and directories is supported and configurable for non-admin users | |
| Callback action/script can be triggered after GenericDevOpsMBean execution. Callback action/script result set can be added to the GenericDevOpsMBean metric alert emails | |
| WLSDM console admin mode feature is added. Only WebLogic administrators were able to access WLSDM admin and config pages. Anymore this feature is configurable, it is able to grant access for non-admin users. system.authorization.wlsdm.console.administrators setting is available on the "Configuration > WLSDM System Settings > System Authorization (tab)" page | |
| Disabling super admin mode functionality is added. Data source password decryption and "Decrypt/Encrypt page" features are configurable anymore. Adding "-Dwlsdm.system.adminModeDisabled=true" JVM argument to WebLogic Administration Server disables "Domain Summary > Data Source Password Decryption" and "Decrypt/Encrypt page" | |
| ECID field is added to backend detail modal windows and notifications pages, emails for all ECID supported event types | |
| Alert generation decision threshold property is added for WebLogic health monitoring. WLSDM generates a HEALTH ALERT notification for the second valid occurrence by using this property with the default '2' INHERIT setting. system.monitoring.health.alarm.generation.alert.decision.threshold property is available in "WLSDM System Settings > system.monitoring (tab)" page | |
| SQL exception filter is added to backend JDBC statement execute notifications | |
| Changing JNDI name for SOADataSource is added | |
| Multi data source support for SOADataSource is added | |
| All the new features are integrated with WL-OPC. WLSDM works more powerful and compatible with central WL-OPC | |
| Poor WebLogic domain performance with slow response times and log inspector monitoring threads encountering frequent timeout errors. To protect the WebLogic domain, LogInspector and Response Time monitoring have been automatically disabled until the performance issue is resolved. Move all rotated WebLogic server, access, diagnostic, and other logs from the default location to improve WebLogic domain performance. For further information, please reach out to our WLSDM and Oracle WebLogic Support team | |
| Possible Root Cause Candidates feature is improved by integrating with the new Slow Trace page | |
| Backend monitoring performance is improved and default event stack trace support is added | |
| WLSDM chart library is upgraded. Charts are more user friendly anymore | |
| WLSDM grid library is upgraded. Flash library is removed and HTML5 export support is added instead | |
| Oracle WebLogic Server 12.2.1.4 boot.properties username/password parse error is fixed | |
| Querying JavaRuntime JMX metric is failing when the JDK build number greater than 200. Valid for JDK 1.6 and 1.8 major releases | |
| In a multi Managed Server targeted GenericDevOpsMBean, custom user message available only one Managed Server MBean | |
| HTML page render error in metric notification page for the row action dropdown menu | |
| Archiving memory usage is reduced and missing archive tables are included | |
| WLSDM backend monitoring threads is not starting after the central license is published by WL-OPC |
v3.7.2 | Released on 2019.05.11
| v3.7.2 is a patch set release | |
| HEALTH monitoring thread stops mysteriously then inconsistency occurs in between WLSDM and WL-OPC. Health monitoring is strengthened and various measures taken | |
| Minor bug-fixes and root-cause modal window UI improvements |
v3.7.1 | Released on 2019.04.01
| 3.7.1 is an Oracle Fusion Middleware (FMW) release. Brand new FMW Component (formerly OPMN) Health Dashboard is available | |
| Consolidated and central Oracle FMW Component health panel is available at WL-OPC health dashboard and integrated with WLSDM component health dashboard | |
| Possible Root Cause feature is added: Back-end Events Operative Set, Top CPU Consumer Threads, JVM (=Managed Server) CPU Usages | |
| Scheduler Jobs page is added. Job Execution History and Job Configuration tabs are available on the "Operational Tools & Utils > Scheduler Jobs / Downtime" page | |
| Stopping and disabling health monitoring for domain resources is added and integrated with WL-OPC. Non-monitored assets are not visible at the central health dashboard anymore | |
| Response-Times ignore-list (URI) feature is added to "Application Response Times Monitoring" | |
| Application "Response Code" monitoring feature is added. Anymore it is possible to monitor and received notifications according to HTTP responses code such as 401,403,500... etc. | |
| The ignore-list feature is added to Back-end Systems monitoring | |
| WLSDM Default Metric Synchronization support is added to default smart dashboards | |
| Auto metric synchronization and tracking support is added to versioned deployments on WebLogic | |
| Log and Response-Times monitoring engine is improved and able to increase the active monitoring threads dynamically | |
| Anymore JMX MBean Browser supports domain-level metrics and global metrics | |
| File Explorer page element labels, path selections and buttons are improved for non-admin users | |
| Monitor WLSDM Agents page is enhanced. WLSDM agent version, build number and WLSDM core module compatibility check is added | |
| WL-OPC integration handlers and performance is improved | |
| Minor and major bug-fixes, customer request implementations, community enhancements are applied |
v3.4.2 | Released on 2018.10.22
| v3.4.2 is a patch set release | |
| License page is giving error while applying official license for trial license expired installation. It is a cache problem and workaround is restarting WebLogic Administration Server. License cache issue is fixed | |
| New line char issue is fixed in embedded scripts for Solaris OS platforms | |
| SOA BPEL engine metric pop-up was not working for the edit operations. The BPEL metric edit issue is fixed. Workaround is editing on the "Metric Settings" page for the BPEL engine metrics | |
| If the generated thread dump is not a full thread dump, "Open With Thread Dump Analyzer" button is not visible anymore on "Profiling Dumps" pages and modal windows | |
| Space characters and white space chars are removed for the "User Defined Generic DevOps MBean" result set | |
| Data archiving module performance is improved and its functionality is changed and its working performance is increased | |
| WL-OPC v1.0.9 integrations and related improvements is reflected | |
| Minor bug-fixes, customer request implementations |
v3.4.1:
| v3.4.1 is an integration release. WLSDM is integrated with WL-OPC which is central WLSDM Operation and Notification Center product. Additionally, WLSDM is integrated with VOI (Volthread Outbound Inspector) which is a central outbound transaction monitoring product | |
| WLSDM is added to Volthread product stack. WLSDM has a brand new logo anymore | |
| WL-OPC (WLSDM Operation Center) support and integration is added. WLSDM is certified with WL-OPC | |
| VOI (Volthread Outbound Inspector) support and integration is added. WLSDM is certified with VOI | |
| HTTP/S outbound monitoring support is added | |
| Page authorizations are enriched to support L1/L2 teams | |
| Page authorizations redesigned. Configuration edit buttons and functionalities are removed for non-administrator users | |
| Expiration reminder e-mail is added for evaluation users | |
| Adding wlsdm_agent to WebLogic Administration Server is harmful. Protection is added. WLSDM blocks WebLogic Administration Server to start and throws error when wlsdm_agent.jar is added to AdminSever startup JVM arguments then Administration Server fails. More detail is available in README | |
| Current JMX MBean metric value is added to "Metric & Chart Options" modal window. It is more helpful while setting alarm thresholds | |
| Notification records are linked to the related monitoring configuration in the all notification pages | |
| MBean metric configuration shortcut is added to "Generic DevOps MBeans" configurations grid | |
| Information tool-tip is added to threshold field on "Physical Resources Metric Configuration" modal window on JVM System Resources page | |
| JVM and physical resources back-end monitoring engine is redesigned and improved | |
| Back-end and MBean metric report engine and report page performance is tuned and improved | |
| Client and server timezone problem is fixed and improved. In WLSDM console only server timezone is valid anymore | |
| Deleted/Removed WebLogic Managed Servers is being cleaned in JMX MBean Metric Browser page | |
| Closing modal windows when pressing ESC key is prevented | |
| OS canonical hostname resolve performance bottleneck is fixed. Caused by Meltdown and Spectre OS patch issues are tested and improved | |
| Deployments which targeted to VirtualHost are visible in Health Dashboard anymore. Health Dashboard was giving error and the problem is resolved | |
| Non-administrator users were unable to rename files in the file explorer page while uploading. Rename error is fixed | |
| MBean Metric report feature "Get Report From Daily Data" was returning only current day's data. Switched to last 24 hours data | |
| SOA module BPEL engine dashboard's metric option modal window UI problem is fixed | |
| In some cases scheduled jobs was not starting. ScheduledJobExecuter back-end startup time problem is fixed | |
| Top loading bar was always visible when no data found in the metric notification page. Loading bar stuck problem is resolved | |
| REMINDER: Customers who have a not valid yearly support license unable to do major upgrade. Warning is added | |
| Minor bug-fixes, continuous UX/UI improvements, customer request implementations |
v3.2.3:
- v3.2.3 is a stabilizing release. Most of current features are more powerful anymore and some new features and enhancements are added
- Operational Notes (Acknowledge) feature is added to Metric Notifications page. Just add an operational note to the metric notifications then publish it to other WebLogic administrators in a team
- Authorization settings and configurations are enhanced. WebLogic "None Administrator" security realm users able to use WLSDM "File Explorer" and "Log Viewer & Tailer" pages anymore. Just configure the settings and let other users (i.e. Developers) see and download WebLogic domain logs by themselves and upload any file to the server
- Scheduler module is enhanced. CRON history is added to scheduler module and WLSDM notifies failed jobs via email
- Changing file/folder permissions is added to File Explorer page
- Response Times monitoring is more robust and strong anymore. Tested with 300k requests per minutes for each WebLogic Managed Server and meanwhile, WLSDM will send slow pages response times as usual with the least overhead
- WLSDM Settings Import/Export feature is enhanced and able to transfer all "Monitoring & Diagnostics" settings
- Storing Garbage Collection metric data is supported anymore
- Open Metric Reports feature is added to Garbage Collection dashboard. Get WebLogic GC report historically
- WLSDM console static file sizes are decreased for improving Oracle Cloud Infrastructure (OCI) experience
- Back-end "Reset to Default" button is added. Back-end settings switch to default WLSDM back-end monitoring settings
- Major/Minor bug-fixes, extreme performance improvements and UX/UI improvements
v3.2.2:
- v3.2.2 is a customer enhancement and additional new features release
- WLSDM supports Oracle WebLogic Server 12.2.1.3 release
- Scheduler module is added. Add any kind of script then schedule it. Add "Quartz Cron Jobs" and visualize WebLogic CRON operations
- Downtime (WLSDM Monitoring) option is added. Add Downtime job and stop all WLSDM monitoring or notifications for the specified date/time interval automatically
- When "downtime is active" or "all the notifications are disabled" Notification icon blinks on every page
- Flight Recorder Repository (Auto JFRs) tab page is added to Profiling Dumps. Lists all auto-created JFR files in one place. Download JFR files and open with Java Mission Control (JMC). Continuous WebLogic monitoring and historical diagnosing, troubleshooting. Identify occurred problems with old JVM snapshots
- Alert Generation/Decision Threshold property is added. WLSDM generates METRIC ALERT notification for the first valid occurrence by using this property with default '1' INHERIT setting. system.monitoring.metric.alarm.generation.alert.decision.threshold property is available in "WLSDM System Settings > system.monitoring (tab)" page
- Unlimited alarm notification delivery feature is added. system.monitoring.metric.alarm.generation.maximum.continuous.delivery.count property is available in "WLSDM System Settings > system.monitoring (tab)" page. (Default: 1, Minimum: 1, Maximum: 20, Unlimited: -1 (Unlimited alarm generation) )
- Known Issue: WLST Web Console page was not working for the WebLogic 12.2.1 release. This problem is resolved permanently and "WLST Web Console" works in every WebLogic release anymore. Supports latest WebLogic releases: 12.2.1.2 and 12.2.1.3
- WLSDM configuration export/import feature is more robust and able to export all the settings/definitions/records anymore
- JVM System Resources page is enhanced. Able to monitor machine/system CPU and Memory usage. Physical System Resources panel is added to page
- Garbage Collection Dashboard page is enhanced. Chart type can be changed. Scatter, Bar, Line options are available for the GC chart
- Notification modal window is redesigned and new features are added. Check notification window in every page
- Bulk "apply dashboard" and "apply action" operations are added to "Metric & Chart Options" window
- Open Metric Reports shortcut button is added to every chart in Smart Dashboards
- Dashboard delete operation is allowed anymore
- JMX MBean metric delete operation is allowed anymore
- ActiveConnectionsUsagePercentage custom MBean is added to data sources dashboard. Default alarm threshold value: 60%
- WebLogic console URL property is added for WLSDM HTML email notifications
- Logged-in user information is added to every page
- Back-end monitoring support is added to latest WebLogic 12.2.1.3 release
- Back-end event monitoring filter threshold property is added. Calculates only back-end events over threshold. Back-end monitoring performance is improved
- SOA Composite Deployed Trends email notification is enhanced. Email delivery canceled if there is no deployment for the previous check (optional)
- Custom Log Monitoring problem for Solaris OS platform is fixed
- Minor bug-fixes, performance and UI improvements
v3.1.2:
- v3.1.2 is a patch set release
- HTML footer is added to License page. Company signature and logo can be added as footer on HTML email notifications (available for registered products)
- Generic DevOps MBean edit options updated
- JFR FlightRecorder repository additional purge management is added
- Restart required Managed Servers are listed on wizard page for response times monitoring
- SOA module composite performance daily report wrong calculation defect is fixed
- Smart email delivery at LogInspector log monitoring defect is fixed
- Viewing Hogger and Stuck notifications stack trace problem is fixed
- Other minor bug-fixes, performance and UI improvements
v3.1.1:
- v3.1 is a major release and contains every detail of WebLogic monitoring and management
- Key feature Generic DevOps MBean is published as:
- Add any kind of scripts and transform them to JMX MBeans then visualize on smart dashboards. Supported scripts: sh, bash, cmd, bat, SQL
- DevOps script integrations: Custom actions, alarm/threshold settings, reporting... etc.
- Thread Pool monitoring is added to smart dashboards
- Identify HOGGER and STUCK thread on metric dashboards
- View HoggingThreadCount and StuckThreadCount threads on Metric Notification page
- View relevant HOGGER and STUCK log notifications on LogInspector
- Browser-based WLSDM PUSH NOTIFICATION Service is added for all notification types. Simply click on it and solve the problem
- Notification actions are added to notification pages: View Threads, Go to Smart Dashboard, View Related Logs, Go to Reports
- Garbage Collection Dashboard is added: Monitoring, Notification, Reporting, GC Log Viewing
- CPU sample (.npss) action is added to system-defined actions
- Daily reports tab is added to Monitoring & Diagnostics page
- Back-end Systems Top Events and daily/weekly/monthly reports
- Response Times Top Requests and daily/weekly/monthly reports
- File Explorer: Web-Based file browser page and upload/download feature is added (CLOUD Feature)
- Custom Log Monitoring: Any type of file and log monitoring is available on LogInspector module
- WebLogic FMW Diagnostics Log and .OUT log monitoring support is added
- Full thread dump generation is added to agentless Managed Servers
- The whole WebLogic domain WLSDM system settings can be Exported/Imported. Export/Import feature is developed for multiple WLSDM installations with the same standard
- Chart ordering feature is added to smart metric dashboards
- Notification pages linked to every page on Notification dropdown menu
- Refreshing all metric value by one click is added to metric dashboards
- Performance Improvements: Tested on a production WebLogic domain that has more than 40 ADF Managed Servers successfully. Improved every page of WLSDM and all the heavy pages are loading faster and lower than 5 seconds
- UI/UX Improvements: We designed one of the best user interfaces for WebLogic monitoring by listening to our community feedback
v2.5.2:
- FMW OSB Monitoring Module is released. (Supports 11g and 12c)
- WLSDM OSB Monitoring, Diagnostics & Report Modules
- OSB Smart Dashboards
- Monitoring ProxyService Performance
- Monitoring Deployed OSB Services Trend
- Summarizing OSB Service List & Endpoint URIs
- OSB Notifications and Alarms
- ProxyService Performance Notifications
- OSB Reports
- Reporting ProxyService Performance
- OSB Daily Reports (EMAIL)
- Daily OSB Report for ProxyService Performance
- Daily SOA Report for Deployed OSB Service Trend
- OSB Smart Dashboards
- WLSDM Core:
- "Health History" page is added. Has Grid and Timeline choice
- Performance improved for health monitoring & health dashboard
- Backend health data cache feature is enabled on health dashboard by default
- Webservice User Test Client does not exist warning is added to "Composite and Service URI" pages
- Bug-fixes, performance and UI improvements
v2.4.0:
- Enable Backend HEALTH Cache feature is added to Health Dashboard. Enable this feature for the domains that have too many resources or heavy page loads. WLSDM applies to backend HEALTH cache data for better performance
- Email "notification recipients" property is enriched. It is possible to send separate HEALTH and METRIC email notifications. Supports L1 and L2 operation teams
- Email addresses are collected as default email list. (Customer request)
- Email Group feature is added (Customer request)
- SMTP connection timeout property is added to system.wlsdm tab
- t3/JMX connection timeout property is added to system.wlsdm tab
- Bug-fixes, performance and UI improvements
v2.3.7:
- Bugs reported by community are fixed
- Performance improved for domains that have more than 40+ Managed Servers
- LogInspector WLDF query name is added to HTML alert emails
- UI improved with UX
v2.3.5:
- OutOfMemoryError log monitoring is added to Log Inspector
- Back-end dashboard infrastructure is improved and new features/events added:
- Able to create unlimited custom back-end dashboards
- Back-end Generic dashboard is added (All-in-one backend dashboard)
- JDBC Dashboard is added
- EJB (EJB Business Method Invoke) Dashboard is added
- Web Services (JAS-WS & JAX-RPC) Dashboard is added
- Socket I/O Dashboard (Socket Read&Write) is added
- File I/O Dashboard (File Read&Write) is added
- Email notification module is enriched
- Able to disable/enable all METRIC CLEAR emails. Default: ON
- Able to disable/enable all HEALTH CLEAR emails. Default: ON
- Able to disable/enable Managed Server health warning email notification. Default: OFF
- Able to disable/enable Managed Server transition states (STARTING, SUSPENDING, FORCE_SUSPENDING, RESUMING, SHUTTING_DOWN, SHUTDOWN_PENDING, SHUTDOWN_IN_PROCESS, FAILED_RESTARTING, FORCE_SHUTTING_DOWN) email notifications
- Able to disable/enable deployment transition states (STARTING, SUSPENDING, FORCE_SUSPENDING, RESUMING, SHUTTING_DOWN, SHUTDOWN_PENDING, SHUTDOWN_IN_PROCESS, FAILED_RESTARTING, FORCE_SHUTTING_DOWN) email notifications. Default: ON
- Reset to default feature is added to notification settings
- "Send Log as Email" feature is added to "Monitoring & Diagnostics > Log Inspector" page
- Alert icon is added to metric dashboards. MBean metric values over threshold blinks anymore (On Grid an Chart Headers)
- All SOA Report grid tables has export data feature as (Copy, CSV, Excel, PDF, Print) anymore
- All SOA Report charts support chart type selection (Line, Bar, Pie... etc.) anymore
- New alert HTML Templates is added and HTML email templates will be upgraded automatically
- Support License information is added to licenses and "Config > License" page
- "Free Developer Edition/License/Support/Evaluation" information badge is added to all pages
- WLSDM sends "Support License expiration warning" in remaining 7 days
- Bug fixes and performance/UI/UX improvements
v2.3.1:
- FMW SOA Monitoring Module is released. (Supports 11g and 12c)
- WLSDM SOA Monitoring, Diagnostics & Report Modules
- SOA Smart Dashboards
- Monitoring BPEL Engine (Only 11g)
- BPEL Engine Dashboard (Historical - Only 11g)
- Monitoring Composite Performance
- Monitoring Callback and Invoke
- Monitoring Composite Faults
- Monitoring Deployed Composites Trend
- Summarizing Composite List & Endpoint URIs
- SOA Notifications and Alarms
- BPEL Engine Notifications
- Composite Performance Notifications
- Callback and Invoke (DLV_MESSAGE) Notifications
- Composite Faults and Errors Notifications
- SOA Reports
- Reporting SOA BPEL Engine
- Reporting SOA Composite Performance
- Reporting SOA Callback and Invoke (DLV_MESSAGE)
- Reporting SOA Composite Faults and Errors
- SOA Daily Reports (EMAIL)
- Daily SOA Report for Composite Performance
- Daily SOA Report for Callback and Invoke (DLV_MESSAGE)
- Daily SOA Report for Composite Faults and Errors
- Daily SOA Report for Deployed Composites Trend
- SOA Smart Dashboards
- WLSDM Core:
- Auto archive feature is added. Configurable and integrated archive module for all the stored data types
- JVM System Resources dashboard is renewed and enriched
- Monitor JVM CPU Load , Heap (Usage, Free, Size)
- Alarm / Notification feature is added to JVM Resources dashboard
- Grid and Chart feature is added
- Health dashboard is renewed and enriched
- Donut charts are added: Health States (WebLogic Servers, Deployments, Data Sources, JMS)
- Server state feature is enriched
- WebLogic server activation time and counter feature is added
- Deletion feature is added to "Monitoring & Diagnostics > Profiling Dumps" page. (Asynchronous file deletion for JFR, WLDF Diagnostic Image, HPROF, LOG)
- New "Operational Tools & Utils > MBean Search" page is added
- Search any text in WebLogic MBean Instance Type
- Search any text in WebLogic MBean Attribute Type
- Search any text in WebLogic MBean Instance Name
- Search any text in WebLogic MBean Attribute Name
- See all the WebLogic MBean attribute values on search results
- Compare WebLogic MBean attribute values
- New "Domain Overview > Timeout Values" page is added.
- WLSDM: Timeouts are the most important settings for keeping the WebLogic domain healthy, strong and responsive
- Important and Recommended WebLogic "Domain Timeouts" MBeans are listed with their values
- Important and Recommended WebLogic "JVM Timeouts" MBeans are listed with their values
- Important and Recommended WebLogic "Server Timeouts" MBeans are listed with their values
- Important and Recommended WebLogic "Data Source Timeouts" MBeans are listed with their values
- WebLogic Runtime JVM arguments and WebLogic console arguments values is added to "Domain Overview > Domain Summary" page
- WebLogic Domain Structure menu items are added as an integrated and dynamic drop-down menu to all WLSDM pages
- WebLogic Administration Server monitoring plug&play application "monitorWLAdmin" is enriched
- General performance and error handling improvements
- Several bug fixes
v2.1.8:
- Bug-fixes and performance improvements
v2.1.7:
- Fresh installation is recommended instead upgrade
- Log Viewer page is enriched
- Back-end monitoring performance improved
- Fetching WebLogic Server log and Response Time records are limited parametrically
- Log Inspector Email Notifications can be continuous or daily once
v2.1.5:
- Monitor WLSDM Agents page is added
- Shutdown servers blink on JVM System Resources dashboard
- Adding User Defined (Log) File feature is added to Log Viewer page
- Send Log Content as HTML EMAIL feature is added to Log Viewer page
- Viewing and filtering weblogic.Stdout and weblogic.Stderr log files
v2.1.1:
- System Resources generic dashboard is added
- Log Viewer page is added to "Operational Tools". View and tail every log file on WLSDM console
v2.0.0:
- Free Developer Edition (Fully Featured) - WLSDM can be used by developers for free!
- WLSDM Quick installation Wizard is more robust anymore. Monitoring & Diagnostics step is added
- Suggest Button for Metric Thresholds on Wizard pages
- Get manual profiling dumps for JFR, Thread Dump, WLDF Diagnostic Image and Heap Dump
- Self-Tuning Thread Pool Threads detail is added for HoggingThreadCount and StuckThreadCount EMAIL notifications
-
Back-end system monitoring
- JDBC Executement Statement
- Webservices JAXWS Endpoint
- EJB Business Method Invoke
- Back-end Reports page is added
- Operational Tools section is added
- WLST Web Console Page
- Storing and Executing WLST Scripts
- Thread Dump Analyzer Page
- Decrypt-Encrypt Page
- Notifications are enriched
- Metric Notifications
- Log Inspector Notifications
- Response Times Notifications
- Back-end Systems Notifications
- Enable/Disable Global Notifications for EMAIL and SNMP By One By
- Enable/Disable All EMAIL-SNMP Notifications feature is added
- SNMP Notification feature is added. Easy SNMP trap configuration:
- SNMP Trap for WebLogic State and Health (Servers, Deployments, Data Sources and JMS)
- SNMP Trap MBean Metric Values
- SNMP Trap for WebLogic Server Logs
- Test SMTP and SNMP settings operations are added to Configuration > System page
- Log Inspector WLDF snippets are added
- Dead Lock
- Heap Space
- Stuck Thread
- Unchecked Exception
- General Severity Error
- WebLogic Domain Summary Page is added
- Data source passwords are listed on domain summary page (Decrypted and Encrypted) - All users are forbidden except administrators
- View WLSDM Log Page is added
- Response Times Chart is added to Monitoring & Diagnostics > Response Times page
- User Defined Metric Actions feature is added. WebLogic domains can be automated according to MBean values
- All users and user groups able to login WLSDM console anymore. Page authorization is enriched
v1.2.0:
- Profiling Dumps page is added to "Monitoring & Diagnostics" category
- Grid status feature is added to dashboard pages
v1.1.2:
- Java Flight Recorder (JFR) dump action is added
- WLDF (WebLogic Diagnostic Framework) Diagnostic Image dump action is added
- Heap dump action is added
v1.1.0:
- Thread dump action is added