Continuous WebLogic Thread Dump Tutorial
How to retrieve the current stack information from a WebLogic server continuously?
"weblogic ebs monitoring"
"weblogic otd monitoring"
"weblogic bi tools monitoring"
"weblogic erp monitoring"
"weblogic e-business suite domain monitoring"
"weblogic service monitoring and snmp trap integrations with solarwinds, hp bsm business service monitoring, microfocus weblogic integration"
"weblogic sql monitoring"2025/08/06

Question:
One of WebLogic Comminity person posted this question on Stackoverflow portal. But unfortunately editors deleted the content. Anyway, which was about getting stack dump or thread dump from WebLogic server.
Our clients have been addressed WLSDM for the solution. Absolutely, WLSDM is the right place to achive this.
Now, we're going to explain how it's easy to do this by using WLSDM which is aimed to monitor WebLogic domains naturally :)
"weblogic stuck monitoring get email alert"
"weblogic thread monitoring and get email alert
"weblogic threadpool monitoring"
"weblogic webservice monitoring"
"weblogic soa suite monitoring"
"weblogic admin console"
Introduction:
Normally, it's easy to do by shell and WLST scripting; but getting thread dump continuously can be challenge and risky. It can create an overhead on your WebLogic domain.
Solution:
Let's say you're familiar with WLSDM. It's really easy to install WLSDM and use it. If you're not introduced with WLSDM for WebLogic just follow this blog post on WLSDM community portal.
WLSDM Intorduction
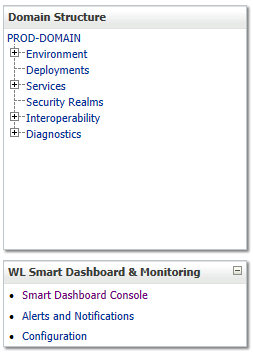
Step-1: Go to "Configuration / System" Page and focus on "system.metric" tab. There are two important properties on WLSDM configuartion/system page. Metric harvest frequency and number of alarm count till alarm situation is valid. Screenshot is below and values are default.
"weblogic monitoring exporter json opensource github"
"weblogic log grafana and prometheus template and elk logstash integration"
"weblogic grafa dashboard"
"weblogic grafana dashboard template, use WLSDM instead"
"weblogic prometheus download use WLSDM instead"
"Use weblogic dashboard to learn more"
The harvest frequency and number of alarm count can be changed. For the continues thread dump, just set it more than 1. Let's set the value to 10. Which means 10 alarms would be generated if the situation is still valid.
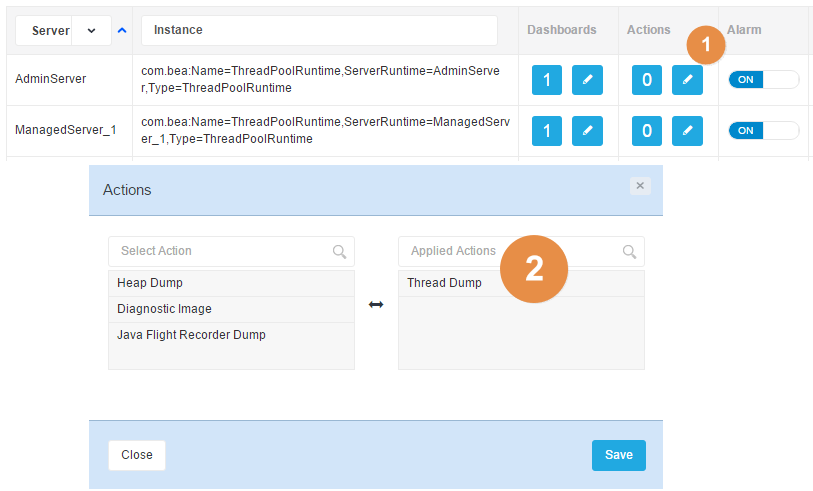
Step-2: Go to "System / Metrics" page. For instance, find ActiveExecuteThread MBean record, then click on "Edit" button. There is Actions button for each servers on WebLogic domain (Screenshot Number-1). Click on actions button and select "Thread Dump" action (Screenshot Number-2) and save. Check below screenshot:
Step-3: The alarm must be enable by setting a threshold value which is less than current ActiveExecuteThread MBean value in ThreadPoolRuntime.
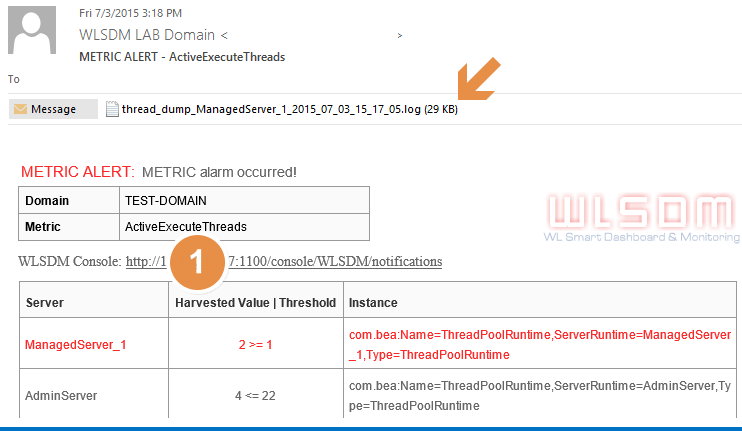
After all, WLSDM would start notifying you via email by attaching
"WebLogic Server Thread Dump" or "Dump Stack"
files continuously. Check below screen shot.
"weblogic domain creation and monitoring"
"weblogic ejb performance monitoring"
"weblogic osb proxy and business service monitoring"
"weblogic web application response time access log"
"weblogic apm application performance monitoring"
"weblogic consumer service"
"weblogic decrypt datasource admin password"-
WLSDM created ALERT notifications every 30 seconds by attaching thread dump files. See pointer.

-
Also the thread dumps are listed on "Profiling Dumps" page on WLSDM console.

-
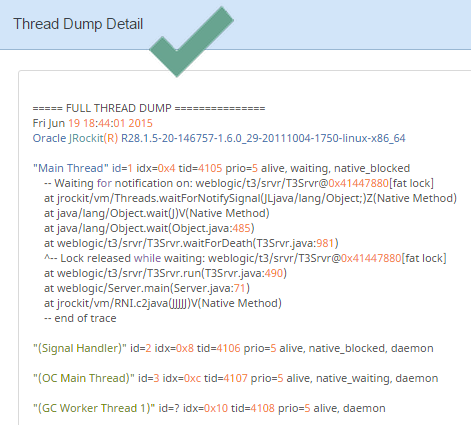
It's possible to analyze thread dumps by using WLSDM's thread dump viewer and analyzer module.
-
Besides thread dump action, there are even more actions available on WLSDM. These are:
- Java Flight Recorder (JFR)
- Heap Dump (.HPROF)
- WebLogic Diagnostic Framework (WLDF) Image (.ZIP)
If you want to learn much about WLSDM actions, there is a good tutorial on Youtube. Here is link: https://www.youtube.com/watch?v=ec-MccMPCqY (WLSDM Actions)
"weblogic remote system monitoring"
"weblogic bi domain"
"oralce erp monitoring and download"
"weblogic adf domain monitoring and adf business components"
"weblogic deployment state monitoring active prepared failed"
"weblogic devops automation auto restart nodemenager"
Hope, you enjoy this detailed answer on WLSDM community portal.
WLSDM Support Team
Source Links:
3- Other YouTube tutorials available.
https://www.youtube.com/channel/UC_xrMkl9iGYk3WslxO1G0dw/videos
"weblogic nodemanager crash recovery"
"weblogic file download and upload from file explorer"
"weblogic file upload web application for developers"
"weblogic jdbc connection and datasource monitoring"
"weblogic jvisualvm cpu and memory dashboards consoles"
"weblogic ohs collacated monitoring"
"weblogic outofmemoryerror analyzer add jvm argument on weblogic console"


