Advanced WebLogic Monitoring: JMX MBean Development Tutorial
Develop JMX MBeans and Automate with WLSDM Metric Actions
2025/08/12

This tutorial is prepared for Advanced WebLogic Administration and Automation. Setting up internal JMX MBean objects are the “best and ultimate practice” for application monitoring infrastructure.
Outline:
- How to develop and register JMX MBean to Oracle WebLogic Server?
- How to check SERVER disk space by using JMX MBean on WebLogic?
- How to define WLSDM User-Defined Metric Actions?
- How to delete or move Application logs automatically when given threshold exceeds for disc usage on SERVER?
Problem: The application which is deployed to Oracle WebLogic Server 12c (12.1.3) is increasing server disk space continuously and in peak times it makes the server disk usage 100%. Meanwhile, the service goes down and causes the service down-time.
Solution:
- Develop JMX MBeans which check server disk usage (JMX StandardMBean)
- Create alarm and notify when the disk usage is over 95% (JMX MBean Monitoring – UsedDiskSpace)
- Create “User-Defined Metric Action” on WLSDM which is targeted to “delete or move application logs”
- Couple “FreeDiskSpace or UsedDiskSpace WebLogic JMX MBean” and “ClearLogs Metric Action”
- When FreeDiskSpace percentage lower than given threshold, “ClearLogs” metric action would be triggered by WLSDM and all application logs would be deleted automatically. That means “NO Down-time” with advanced WebLogic monitoring and automation.
Video Tutorial & Custom JMX Source Code (Java):
An 8 Minutes tutorial is prepared for this problem and for any other similar problems.
The tutorial is short and targeted to overcome SERVER disk problem.
Watch Tutorial:
-
Download Source Code (Sample Project and WAR):
ZIP file contains “WAR File” and “JAVA Eclipse Project”Download: WLSDMMonitoringSamples.zip
How to develop your own JMX MBean and JMX Metric Action? (SUMMARY)
Above video tutorial and sample project quite enough to setup an advanced WebLogic monitoring and automation infrastructure. Senior WebLogic Administrators, DevOps or Developers had better consider every problematic issues while managing mission-critical WebLogic domains.
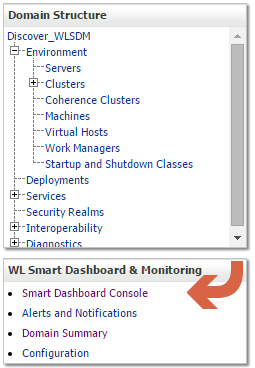
- Login to WebLogic Console
-
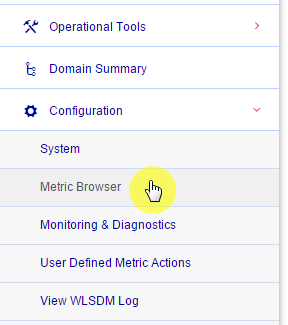
Go to WLSDM Console Metric Browser Page
-
Play with WLSDM Metric Browser. It displays all WebLogic JMX MBeans dynamically.
“WLSDM Console > Configuration > Metric Browser”
-
a) Develop JMX StandartMBean
b) Register to WebLogic MBean ServerWe have prepared a sample JMX Bean which checks “Free Disk Space” and “Used Disk Space” on server.
Check Sample Java Source and develop your own JMX MBeans then deploy the package (internal or external) as an application to the WebLogic domain.
WLSDMMonitoringSamples.zip: Contains Eclipse Project and Deploy-able WAR File (Supports WebLogic 11g and 12c)
Download: WLSDMMonitoringSamples.zip
package com.wlsdm.samples; public interface DiskSpaceWatcherMBean { public double getFreeDiskSpace(); public void setFreeDiskSpace(double fds); public double getUsedDiskSpace(); public void setUsedDiskSpace(double uds); }package com.wlsdm.samples; import java.io.File; import javax.management.StandardMBean; import javax.swing.filechooser.FileSystemView; public class DiskSpaceWatcher extends StandardMBean implements DiskSpaceWatcherMBean { public double FreeDiskSpace = new Double(100.00); public double UsedDiskSpace = new Double(0.00); protected DiskSpaceWatcher() { super(DiskSpaceWatcherMBean.class, false); Thread t = new Thread(new CollectData()); t.start(); } @Override public double getFreeDiskSpace() { return FreeDiskSpace; } @Override public void setFreeDiskSpace(double fds) { FreeDiskSpace = fds; } @Override public double getUsedDiskSpace() { return UsedDiskSpace; } @Override public void setUsedDiskSpace(double uds) { UsedDiskSpace = uds; } private class CollectData implements Runnable { @Override public void run() { while (true) { File f = FileSystemView.getFileSystemView().getHomeDirectory(); double free = ((double)f.getUsableSpace() / f.getTotalSpace()) * 100.00d; setFreeDiskSpace(free); setUsedDiskSpace(100.00 - free); try { Thread.sleep(60 * 1000); } catch (InterruptedException e) { e.printStackTrace(); } } } } }package com.wlsdm.samples; import java.io.IOException; import java.util.Hashtable; import javax.management.MBeanServer; import javax.management.ObjectName; import javax.naming.Context; import javax.naming.InitialContext; import javax.servlet.GenericServlet; import javax.servlet.ServletException; import javax.servlet.ServletRequest; import javax.servlet.ServletResponse; public class DiskSpaceWatcherListener extends GenericServlet { private static final long serialVersionUID = 1L; public void destroy() { try { Hashtable -
Deploy WebApplication to WebLogic
Note: WLSDMMonitoringSamples.war can be used for completing this tutorial.
-
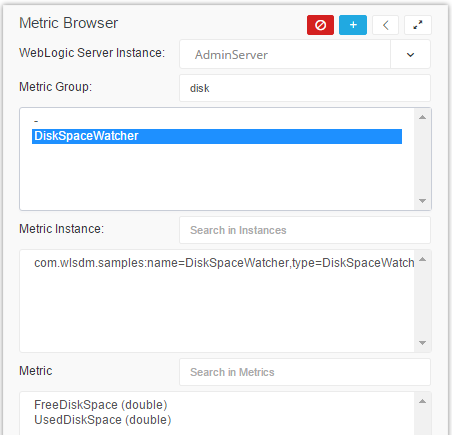
Check new deployed JMX Custom MBeans on WLSDM Metric Browser page for DiskSpaceWatcher MBeans. Anymore FreeDiskSpace and UsedDiskSpace JMX MBeans are visible on WLSDM Metric Browser (Without WebLogic Server restart)
-
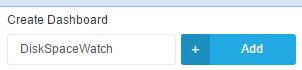
Create new Dashboard and name it DiskSpaceWatch.
-
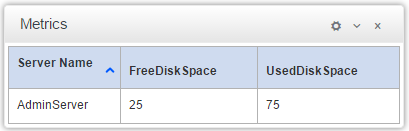
Add FreeDiskSpace and UsedDiskSpace JMX Metrics to DiskSpaceWatch Dashboard and save all.
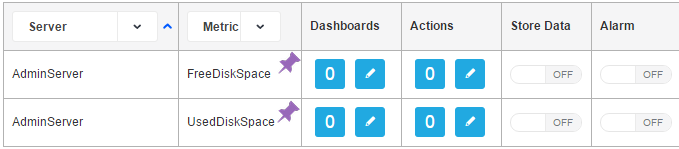
-
Anymore Custom JMX MBeans that we developed and its values can be visualize on WLSDM Console Smart Dashboards. You would see two charts on DiskSpaceWatch dashboard as below.
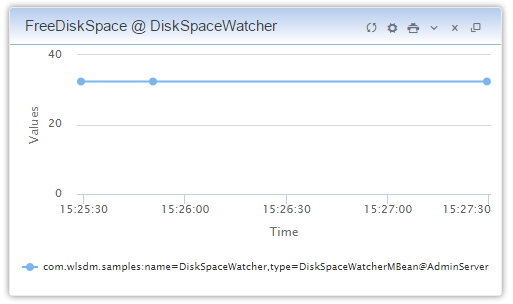
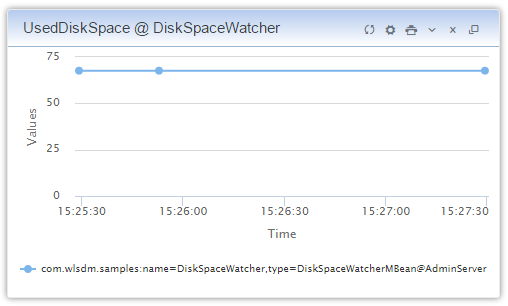
-
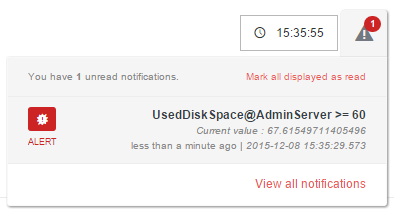
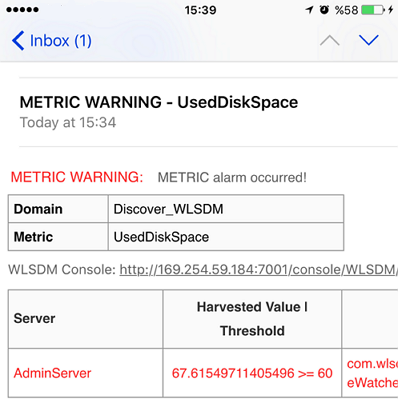
Set threshold values for FreeDiskSpace and UsedDiskSpace MBeans and see what will happen? Test it by setting low thresholds. For instance, set threshold value for UsedDiskSpace to “60” and get below notifications.JMX MBean monitoring alarms would be generated by WLSDM as page and email Notification.
-
Now Define Custom Metric Actions for FreeDiskSpace:
Custom metric actions can be defined on WLSDM. Now going to create a custom action for FreeDiskSpace metric. -
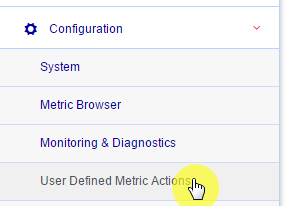
Go to “Configuration > User-Defined Metric Actions” Page.
-
Create new “User-Defined Metric Action” as below.
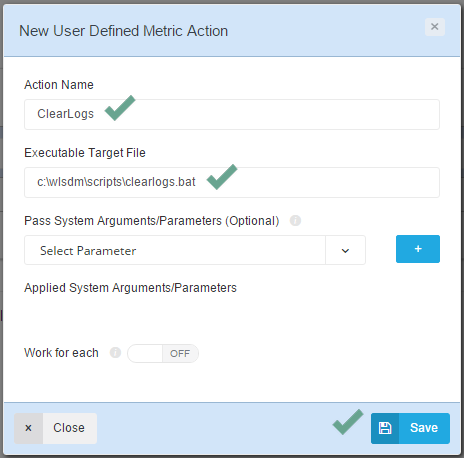
Note: “Executable Target Files” can be .SH or .BAT file. System Paremeters such as $METRIC_NAME, $METRIC_VALUE can be passed to “Executable Target File” as argument by WLSDM
Content of “clearlogs.bat” file:
cd C:\wlsdm\logs
del /F /Q *.*
-
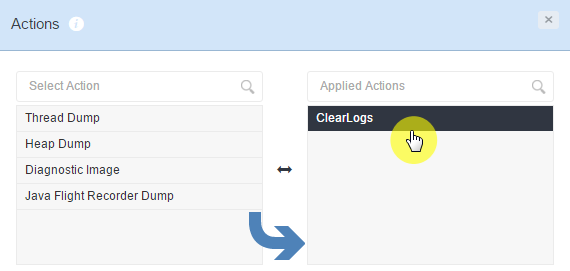
Anymore “ClearLogs” Cusom Action can be listed on Actions Window. Select “ClearLogs”.
- Reset UsedDiskSpace or FreeDiskSpace Metric threshold value and get METRIC CLEAR alarm from WLSDM. (For testing ClearLogs action)
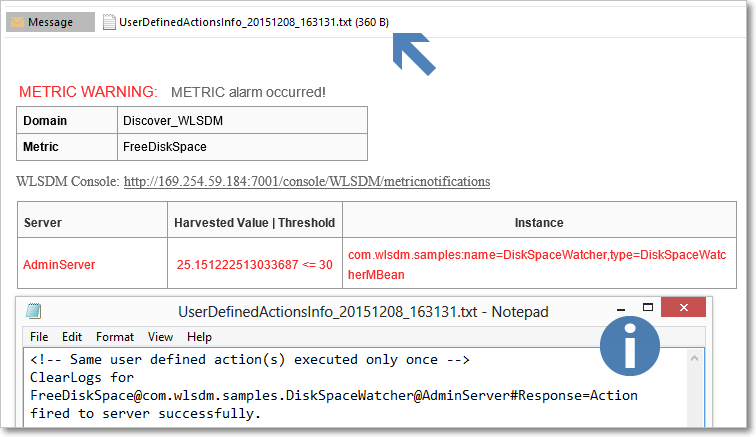
- Reassign threshold value for FreeDiskSpace metric and get METRIC WARNING alarm from WLSDM. (ie. set lower than 30)
-
Oops! FreeDiskSpace alarm generated! And ClearLogs action has been executed automatically. All logs under C:\wlsdm\logs has been deleted.
- End of tutorial. Monitoring is meaningful and powerful with automation.
Advanced WebLogic Monitoring: Best & Ultimate Practice
Think about your chronic runtime problems and develop your own JMX MBeans then overcome all manual processes. This method is the best and ultimate monitoring infrastructure for the mission-critical applications. High level DevOps engineers, developers or architects should deliver their WebLogic IT projects with monitoring infrastructure. Should think about potential LIVE/PRODUCTION issues and should implement before going live. It is possible with WebLogic and WLSDM Metric Actions.
Download Latest WLSDM for WebLogic 11g, 12c and 14c
- Latest Version: v4.1.2 Watch WLSDM Trailer
- Quick Installation Guide: Available in ZIP package as README.html
- Online Documentation: Available in ZIP package as WLSDM-HELP.html