WebLogic Monitoring Alerts
WebLogic Monitoring Alerts
2025/07/29

weblogic monitoring alerts: useful alert metrics
weblogic monitoring alerts: useful alert metrics
Step 1: Welcome: Wizard introduction
Step 2: License Information
After accepting the license agreement, WLSDM offers two options:
- Evaluate for 15 days:
If you do not have a valid WLSDM license key, choose this option for the evaluation. After 15 days WLSDM will ask for a valid license.
- Enter license key:
If you have a valid WLSDM license key, choose this option and enter the appropriate license information. The license key will be checked offline and activated instantly if it is a valid key.
Step 3: Alarm Configuration (Optional)
In step 3, the SMTP settings and email recipients can be configured easily. These settings can be left blank, but it is highly recommended to configure these settings successfully.
By setting up email configuration WLSDM will send notifications and HTML email alerts.
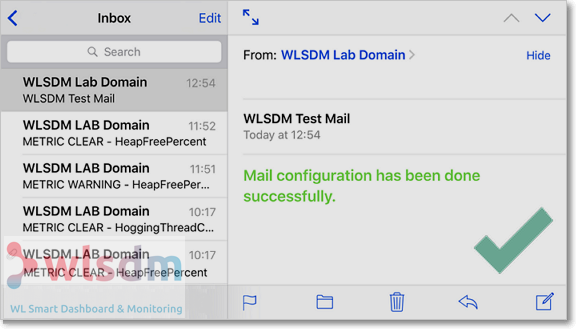
Use "Send" button for testing SMTP settings. If you configured the SMTP settings successfully, you will get a test email as below.

If any error occurs then check wlsdm.log file which is located under $WL_DOMAIN_HOME/WLSDM/logs folder.
Step 4: Reading Domain
WLSDM reads WebLogic domain and lists the domain resources to configure monitoring settings.
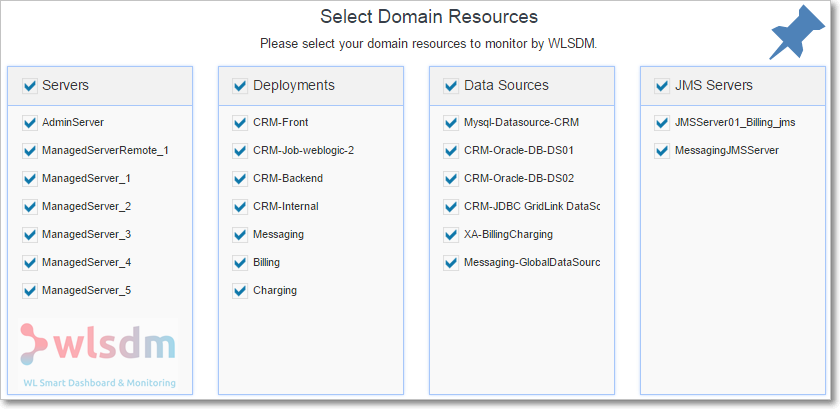
Step 5: Domain Resources
There are four main groups which WLSDM offers to monitor: Servers, Deployments, Data Sources and JMS
Select domain resources to monitor. All important domain resources are selected by default. These can be unselected in this step.

Step 6: Metric Configuration
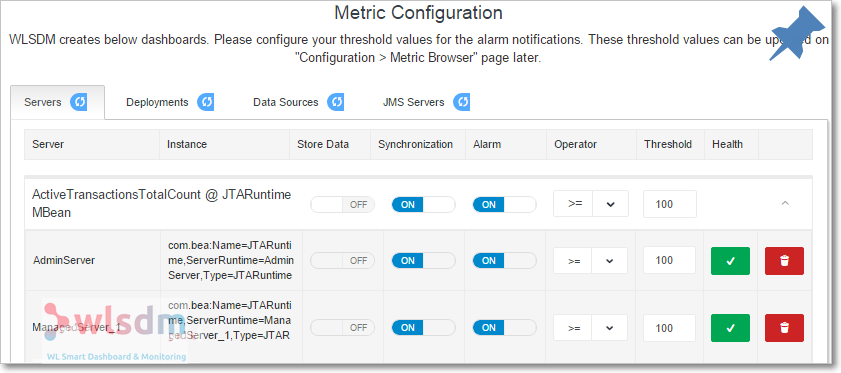
This is most important step and highly recommended to complete carefully. WLSDM offers important WebLogic MBean metrics to monitor according to domain’s available resources.
Complete Step-6 operations as:
| 1. Check metric values: | All available metrics are grouped by WebLogic servers. All the sub instance threshold values can be set on main metric record. Click on threshold editbox and see current instance values. |

| 2. Set threshold values: | Give reasonable threshold values according to the WebLogic domain characteristic. |
| 3. Enable/Disable alarm: | It can be done by using ON/OFF button on “Alarm” column. |
| 4. Delete metric instance: | It is also possible to remove the metric instance. |
| 5. Reset values and configurations: | All the configurations, values and deletion processes can be reset by clicking on refresh icons on metric group tabs. |
Step 7: Finish
It is unable to access to the wizard page after completing WLSDM monitoring wizard steps. But all the configurations and values can be updated on Configuration/Metrics and Dashboard pages.
mbean node type : weblogic.management.runtime.ThreadPoolRuntimeMBean
metric : ActiveExecuteThreads
instance : com.bea:Name=ThreadPoolRuntime,ServerRuntime=WEBLOGIC_SERVER_NAME,Type=ThreadPoolRuntime
mbean node type : weblogic.management.runtime.ThreadPoolRuntimeMBean
metric : HoggingThreadCount
instance : com.bea:Name=ThreadPoolRuntime,ServerRuntime=WEBLOGIC_SERVER_NAME,Type=ThreadPoolRuntime
mbean node type : weblogic.management.runtime.ThreadPoolRuntimeMBean
metric : PendingUserRequestCount
instance : com.bea:Name=ThreadPoolRuntime,ServerRuntime=WEBLOGIC_SERVER_NAME,Type=ThreadPoolRuntime
mbean node type : weblogic.management.runtime.ServerRuntimeMBean
metric : OpenSocketsCurrentCount
instance : com.bea:Name=WEBLOGIC_SERVER_NAME,Type=ServerRuntime
mbean node type : weblogic.management.runtime.JRockitRuntimeMBean
metric : HeapFreePercent
instance : com.bea:Name=WEBLOGIC_SERVER_NAME,ServerRuntime=WEBLOGIC_SERVER_NAME,Type=JRockitRuntime
mbean node type : weblogic.management.runtime.JRockitRuntimeMBean
metric : JvmProcessorLoad
instance : com.bea:Name=WEBLOGIC_SERVER_NAME,ServerRuntime=WEBLOGIC_SERVER_NAME,Type=JRockitRuntime
mbean node type : weblogic.management.runtime.JVMRuntimeMBean
metric : HeapFreePercent
instance : com.bea:Name=WEBLOGIC_SERVER_NAME,ServerRuntime=WEBLOGIC_SERVER_NAME,Type=JVMRuntime
mbean node type : weblogic.management.runtime.JVMRuntimeMBean
metric : JvmProcessorLoad
instance : com.bea:Name=WEBLOGIC_SERVER_NAME,ServerRuntime=WEBLOGIC_SERVER_NAME,Type=JVMRuntime
mbean node type : weblogic.management.runtime.JTARuntimeMBean
metric : ActiveTransactionsTotalCount
instance : com.bea:Name=JTARuntime,ServerRuntime=WEBLOGIC_SERVER_NAME,Type=JTARuntime
mbean node type : weblogic.management.runtime.ThreadPoolRuntimeMBean
metric : Throughput
instance : com.bea:Name=ThreadPoolRuntime,ServerRuntime=WEBLOGIC_SERVER_NAME,Type=ThreadPoolRuntime
mbean node type : weblogic.management.runtime.ThreadPoolRuntimeMBean
metric : Throughput
instance : com.bea:Name=ThreadPoolRuntime,ServerRuntime=WEBLOGIC_SERVER_NAME,Type=ThreadPoolRuntime
weblogic monitoring alerts
mbean node type : weblogic.management.runtime.JTARuntimeMBean
metric : TransactionRolledBackTotalCount
instance : com.bea:Name=JTARuntime,ServerRuntime=WEBLOGIC_SERVER_NAME,Type=JTARuntime
weblogic monitoring alerts

weblogic monitoring alerts
weblogic monitoring dashboardweblogic monitoring alerts
weblogic monitoring alerts
WLSDM: Monitoring Performance Using the WebLogic Diagnostics Framework and WLSDM
A quick tour of your options for gathering server and application performance data from Oracle WebLogic Server by using WLSDM.
Native WebLogic Monitoring
The WebLogic Diagnostics Framework (WLDF) is a suite of services and APIs designed to provide the ability to collect and surface metrics that provide visibility into server and application performance.
WLSDM is able to Monitoring for SLA violations
WLSDM is able to Monitoring CPU load
WLSDM is able to Graphing method and MBean data
WLSDM is able to Finding bottleneck methods
How to configure WLSDM and your application to utilize WLSDM services and WebLogic Monitoring Alerts
How to use WLST (WebLogic Scripting Tool) and the WLDF Runtime MBean API for extracting and using the data generated by WLSDM
How to use the WLSDM console extension to visualize diagnostic data. WLSDM is Native WebLogic Smart Dashboard and Monitoring tool for free try. Download WLSDM for WebLogic monitoring alerts and notifications.
Download Latest WLSDM for WebLogic 11g, 12c and 14c
- Latest Version: v4.1.2 Watch WLSDM Trailer
- Quick Installation Guide: Available in ZIP package as README.html
- Online Documentation: Available in ZIP package as WLSDM-HELP.html

