WebLogic Server Health Status: WLSDM Smart Dashboards
WebLogic Server Health Status: WLSDM Smart Dashboards
2025/08/07

Smart Dashboards / Health (Static Dashboard)
WLSDM has an integrated health monitoring module. This module contains:
- Health Dashboard
- Health Changes Notifications via EMAIL and SNMP (Alert and Clear)
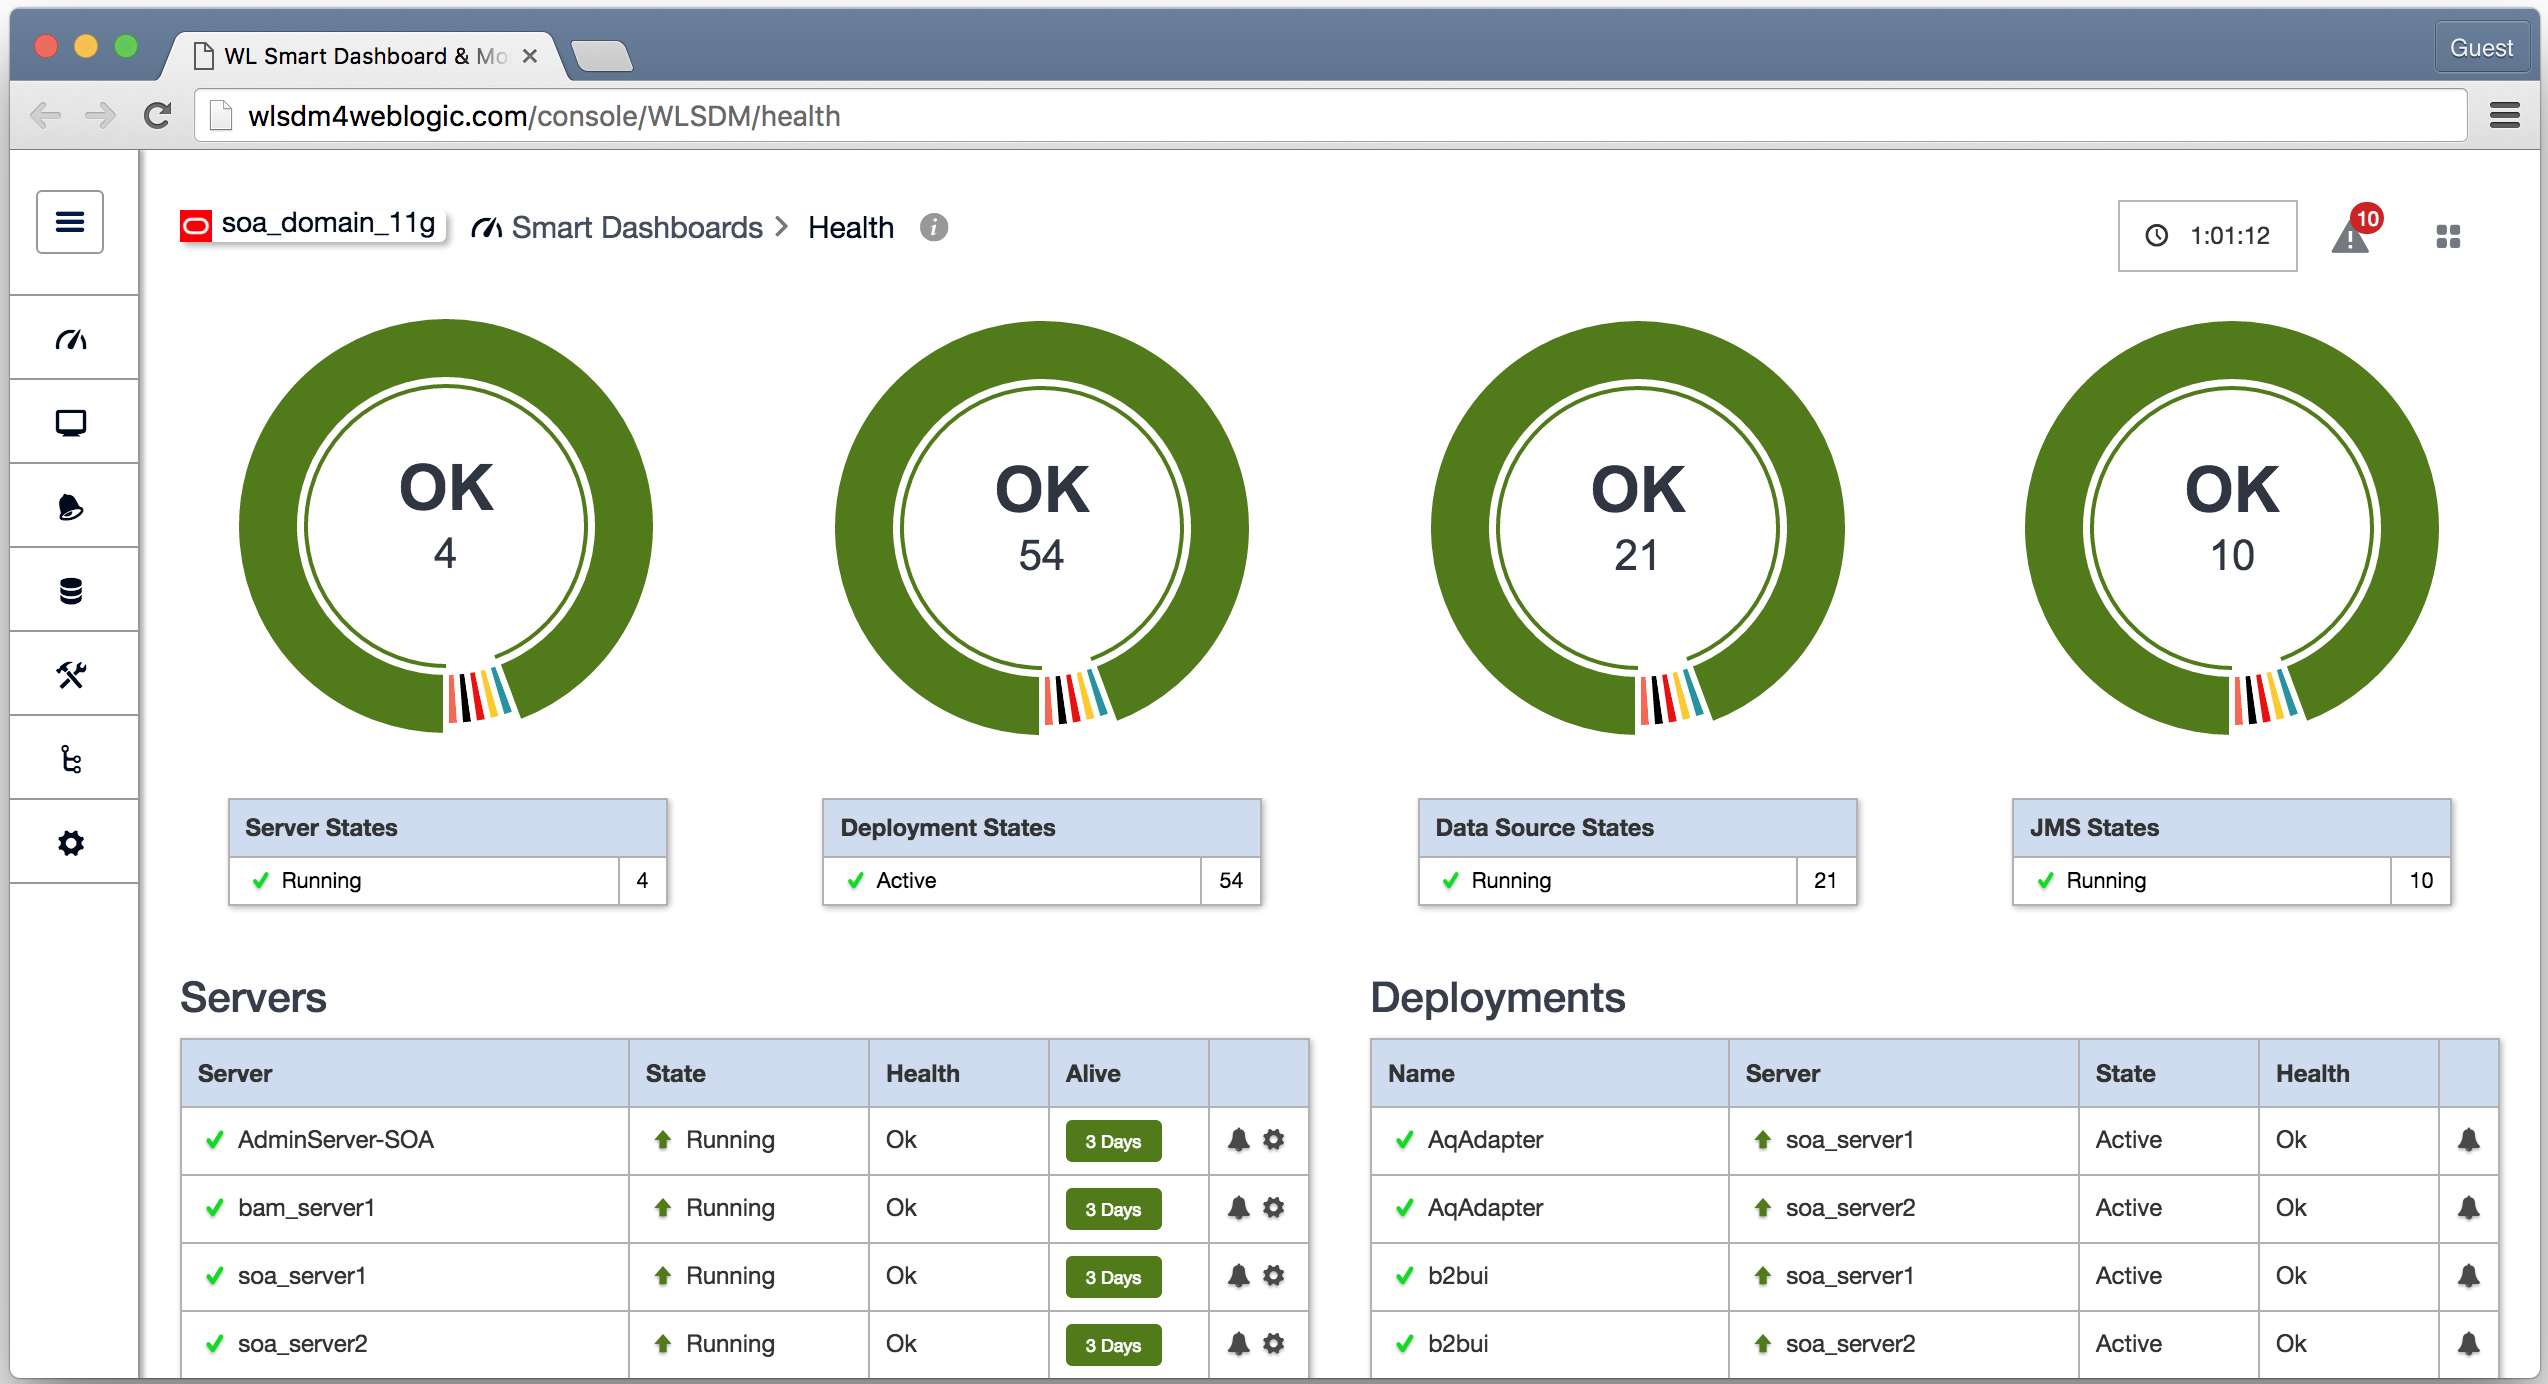
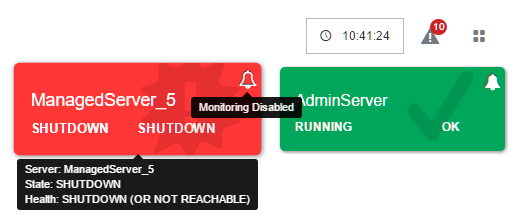
Health Dashboard
First, Health Dashboard doesn't needs an configuration. All module dynamically configured and built up by WLSDM
Health Dashboard can monitor:
- Servers State and Health
- Deployments State and Health
- Data Sources State and Health
- JMS State and Health
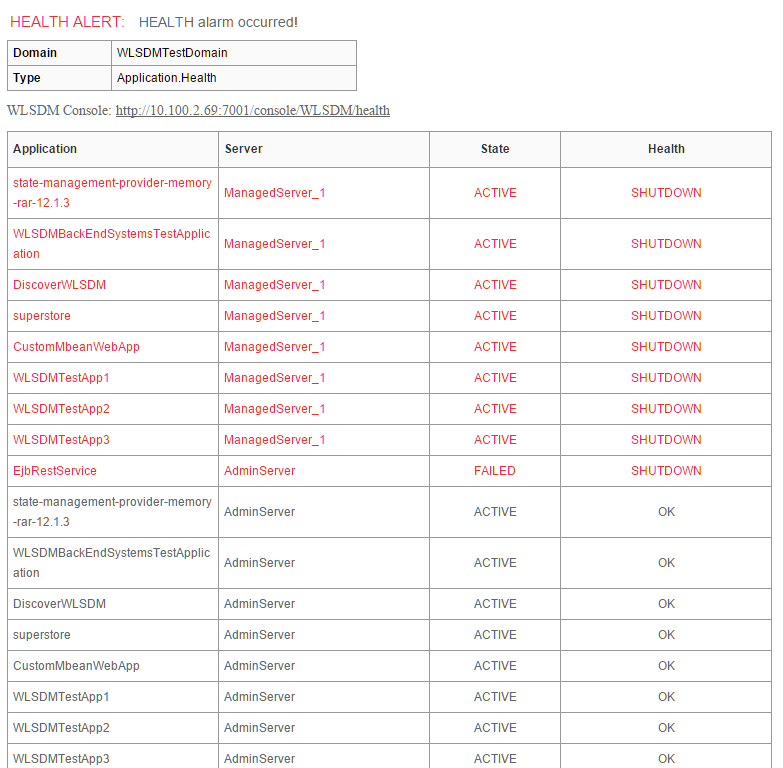
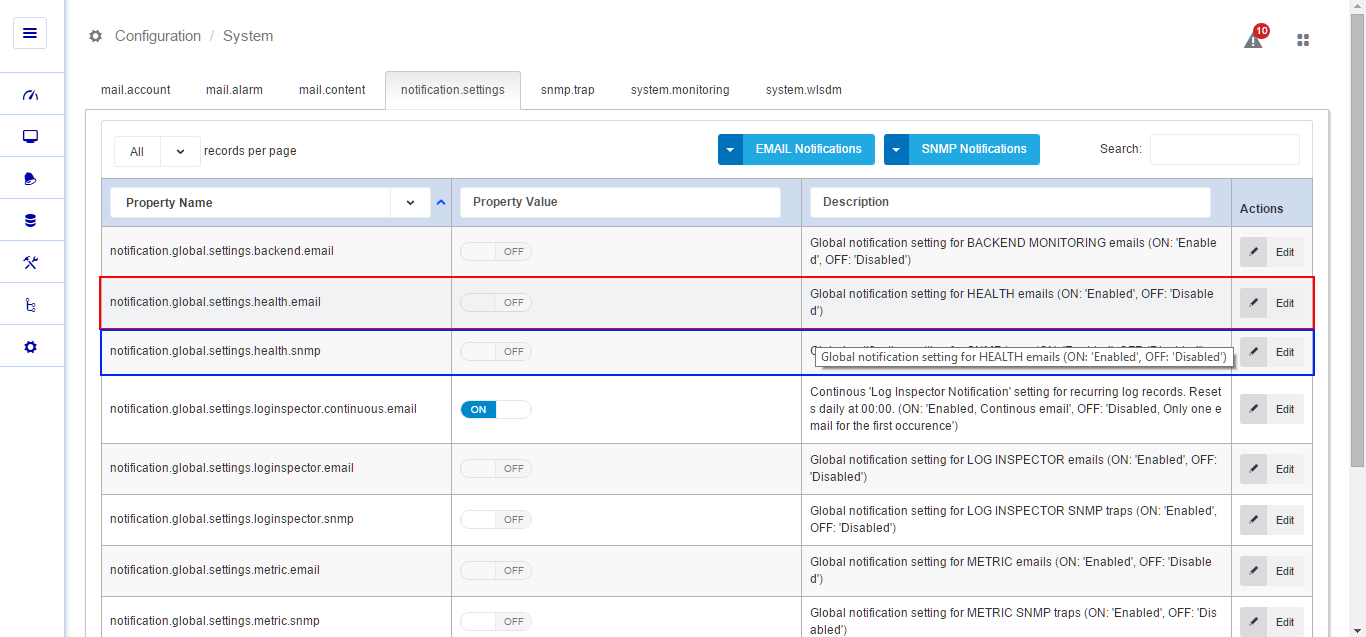
Email Notifications
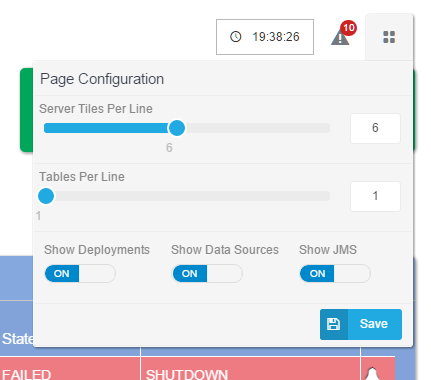
Page Configuration
Via page configuration menu you can change:
- Server tile perline (min: 1, max:12)
- Monitoring tables (Deployments, Data Sources, JMS) per line (min: 1, max: 3)
- Show / hide monitoring tables
If you don't want to notifications about an asset, just click to bell
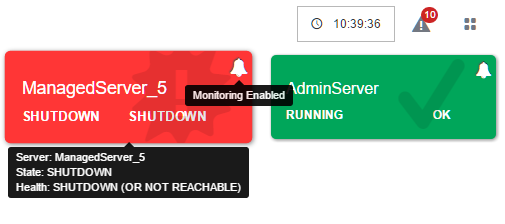
To turn ON / OFF all notifications:
To check out other features: wlsdm.com/download/
WLSDM is a WebLogic Server conslole extension. So we call it native monitoring.
WLSDM installation takes just minutes and completely free in WebLogic development mode! Try it now.
Download Latest WLSDM for WebLogic 11g, 12c and 14c
- Latest Version: v4.1.2 Watch WLSDM Trailer
- Quick Installation Guide: Available in ZIP package as README.html
- Online Documentation: Available in ZIP package as WLSDM-HELP.html
To your advice and questions: community.wlsdm.com
WebLogic Server Health Status: WLSDM Smart Dashboards. Easy, fast and responsive monitoring & diagnostic.
WLSDM WebLogic Monitoring Tutorials
- How to install and use WLSDM?
YouTube Tutorial - Advanced WebLogic Monitoring and Automation:
Develop JMX MBeans (YouTube Tutorial, Sample JAVA Code, Documentation) - How to get WebLogic thread dump continuously?
Community Blog Post - Dashboard Usage
YouTube Tutorial - Actions (Thread Dump, Heap Dump, Java Flight Recorder (JFR), WLDF Image)
YouTube Tutorial - JMX MBean Metric Browser & Email Notifications
YouTube Tutorial - Application Response Times & Log Inspector
YouTube Tutorial