WebLogic Performance Monitoring: WLSDM Smart Dashboards
WebLogic Performance Monitoring: WLSDM Smart Dashboards
2025/08/10

Default Dashboards
Servers, Deployments, Data Sources and JMS Servers dashboards are default dashboards which are created at wizard steps.
Dashboard page operations are as below:
Can update dashboard name
Can change "Metric Load Range" historically (Minimum 1 minute)
Can change automatic "Page Refresh Frequency" (Minimum 30 seconds)
Can change number of charts per line (Minimum 1 chart)
Can change chart heights (Minimum 100px)
Can change grid display status (Show / Hide)

How to monitor WebLogic JMX MBean values on WebLogic Monitoring Dashboard?
Simply just use WebLogic "Servers, Data Sources, Deployments, JMS" dashboards on WLSDM which are under "Smart Dashboards"
Metric and Chart Options
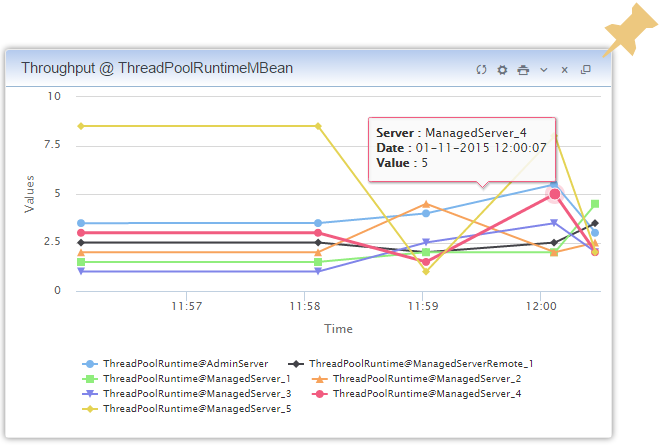
Opens the "Metric and Chart" Options window. All the operations can be done on this window easily.
- Can change "Metric Chart Type"
- Alarm settings (ON / OFF)
- Action settings (Thread Dump, Heap Dump, Java Flight Recorder Dump, WLDF Diagnostic Image)
- Synchronization settings (Controlling extended WebLogic servers)
- Monitoring metric instance health
- Can change metric's dashboard settings to show on which dashboard to display Important Feature: A metric can be assign multiple dashboard on "Edit Dashboards" modal window as below.
Download Latest WLSDM for WebLogic 11g, 12c and 14c
- Latest Version: v4.1.2 Watch WLSDM Trailer
- Quick Installation Guide: Available in ZIP package as README.html
- Online Documentation: Available in ZIP package as WLSDM-HELP.html

