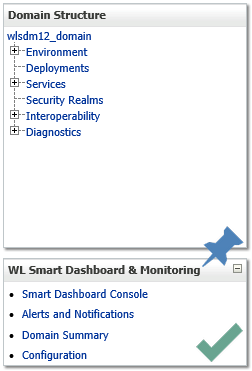
WLSDM Smart Dashboard & Monitoring Console can be launched from the
WebLogic Server Administration Console, or you can run it separately in a web
browser by typing "http:// ${ADMIN_SERVER_IP} : {PORT} /console/WLSDM " on the
address bar.
WLSDM Monitoring Dashboard is always displayed in its own console,
or pages. You do not need to be logged in to the Administration Console
to use the WLSDM Monitoring Dashboard; but if you are not logged in to
the WebLogic Console, you are prompted for your username and password credentials.
Only users who have Administration roles can be logged in to the WLSDM console.
WebLogic console extension
mbean node type : weblogic.management.runtime.ThreadPoolRuntimeMBean metric : ActiveExecuteThreads instance : com.bea:Name=ThreadPoolRuntime,ServerRuntime=WEBLOGIC_SERVER_NAME,Type=ThreadPoolRuntime mbean node type : weblogic.management.runtime.ThreadPoolRuntimeMBean HoggingThreadCount com.bea:Name=ThreadPoolRuntime,ServerRuntime=WEBLOGIC_SERVER_NAME,Type=ThreadPoolRuntime mbean node type : weblogic.management.runtime.ThreadPoolRuntimeMBeanmetric : PendingUserRequestCountinstance : com.bea:Name=ThreadPoolRuntime,ServerRuntime=WEBLOGIC_SERVER_NAME,Type=ThreadPoolRuntimembean node type : weblogic.management.runtime.ServerRuntimeMBeanmetric : OpenSocketsCurrentCountinstance : com.bea:Name=WEBLOGIC_SERVER_NAME,Type=ServerRuntimembean node type : weblogic.management.runtime.JRockitRuntimeMBeanmetric : HeapFreePercentinstance : com.bea:Name=WEBLOGIC_SERVER_NAME,ServerRuntime=WEBLOGIC_SERVER_NAME,Type=JRockitRuntimembean node type : weblogic.management.runtime.JRockitRuntimeMBeanmetric : JvmProcessorLoadinstance : com.bea:Name=WEBLOGIC_SERVER_NAME,ServerRuntime=WEBLOGIC_SERVER_NAME,Type=JRockitRuntimembean node type : weblogic.management.runtime.JVMRuntimeMBeanmetric : HeapFreePercentinstance : com.bea:Name=WEBLOGIC_SERVER_NAME,ServerRuntime=WEBLOGIC_SERVER_NAME,Type=JVMRuntime mbean node type : weblogic.management.runtime.JVMRuntimeMBean metric : JvmProcessorLoadinstance : com.bea:Name=WEBLOGIC_SERVER_NAME,ServerRuntime=WEBLOGIC_SERVER_NAME,Type=JVMRuntime mbean node type : weblogic.management.runtime.JTARuntimeMBean metric : ActiveTransactionsTotalCountinstance : com.bea:Name=JTARuntime,ServerRuntime=WEBLOGIC_SERVER_NAME,Type=JTARuntime mbean node type : weblogic.management.runtime.ThreadPoolRuntimeMBeanmetric : Throughputinstance : com.bea:Name=ThreadPoolRuntime,ServerRuntime=WEBLOGIC_SERVER_NAME,Type=ThreadPoolRuntime mbean node type : weblogic.management.runtime.ThreadPoolRuntimeMBeanmetric : Throughputinstance : com.bea:Name=ThreadPoolRuntime,ServerRuntime=WEBLOGIC_SERVER_NAME,Type=ThreadPoolRuntime weblogic 12c monitoring dashboardmbean node type : weblogic.management.runtime.JTARuntimeMBeanmetric : TransactionRolledBackTotalCountinstance : com.bea:Name=JTARuntime,ServerRuntime=WEBLOGIC_SERVER_NAME,Type=JTARuntime
This blog post describes the WLSDM Monitoring Dashboard, which provides views and tools for graphically presenting diagnostic data about servers and applications running on them. The underlying functionality for generating, retrieving, and persisting diagnostic data is provided by the WebLogic Diagnostics Framework (WLDF). The Monitoring Dashboard provides additional tools for presenting that data in charts and graphs.This chapter includes the following sections:WLSDM Running the Monitoring DashboardWLSDM Scope of the Diagnostic Information DisplayedWLSDM About the Monitoring Dashboard InterfaceWLSDM Understanding How Metrics Are Collected and PresentedWLSDM The Parts of a ChartWLSDM Running the Monitoring DashboardWLSDM You can launch the Monitoring Dashboard from the WebLogic Server Administration Console, or you can run it separately in a web browser. The Monitoring Dashboard is always displayed in its own tab, or window, depending on the preferences you have set for your browser. You do not need to be logged in to the Administration Console to use the Monitoring Dashboard; but if you are not logged in, you are prompted for your username and password credentials.WLSDM For more information, see "Launch the Monitoring Dashboard" in Oracle WebLogic Server Administration Console Online Help.Scope of the Diagnostic Information DisplayedWLSDM: Native WebLogic Monitoring Tool The diagnostic data displayed by the Monitoring Dashboard consists of run-time MBean attributes with numeric or Boolean values that are useful to measure, either as their current values or as their changes over time. These values, referred to in the Monitoring Dashboard as metrics, originate from one or more run-time MBean instances from one or more servers in the domain.WLSDM: Native WebLogic Monitoring Tool The Monitoring Dashboard obtains metrics from two sources:WLSDM: Native WebLogic Monitoring Tool Directly from active run-time MBean instances — these metrics are sometimes called polled metrics in this chapter.WLSDM: Native WebLogic Monitoring Application From the Archive that have been collected by the Harvester — these metrics are also known as collected metrics to distinguish them from metrics whose values are obtained directly from active run-time MBean instances and returned to the Monitoring Dashboard.WLSDM: Native WebLogic Monitoring Application About the Monitoring Dashboard InterfaceThe Monitoring Dashboard has two main panels: the explorer panel and the view display panel, as shown in the following figure