WebLogic Monitoring Tools
WLSDM Performance Metrics
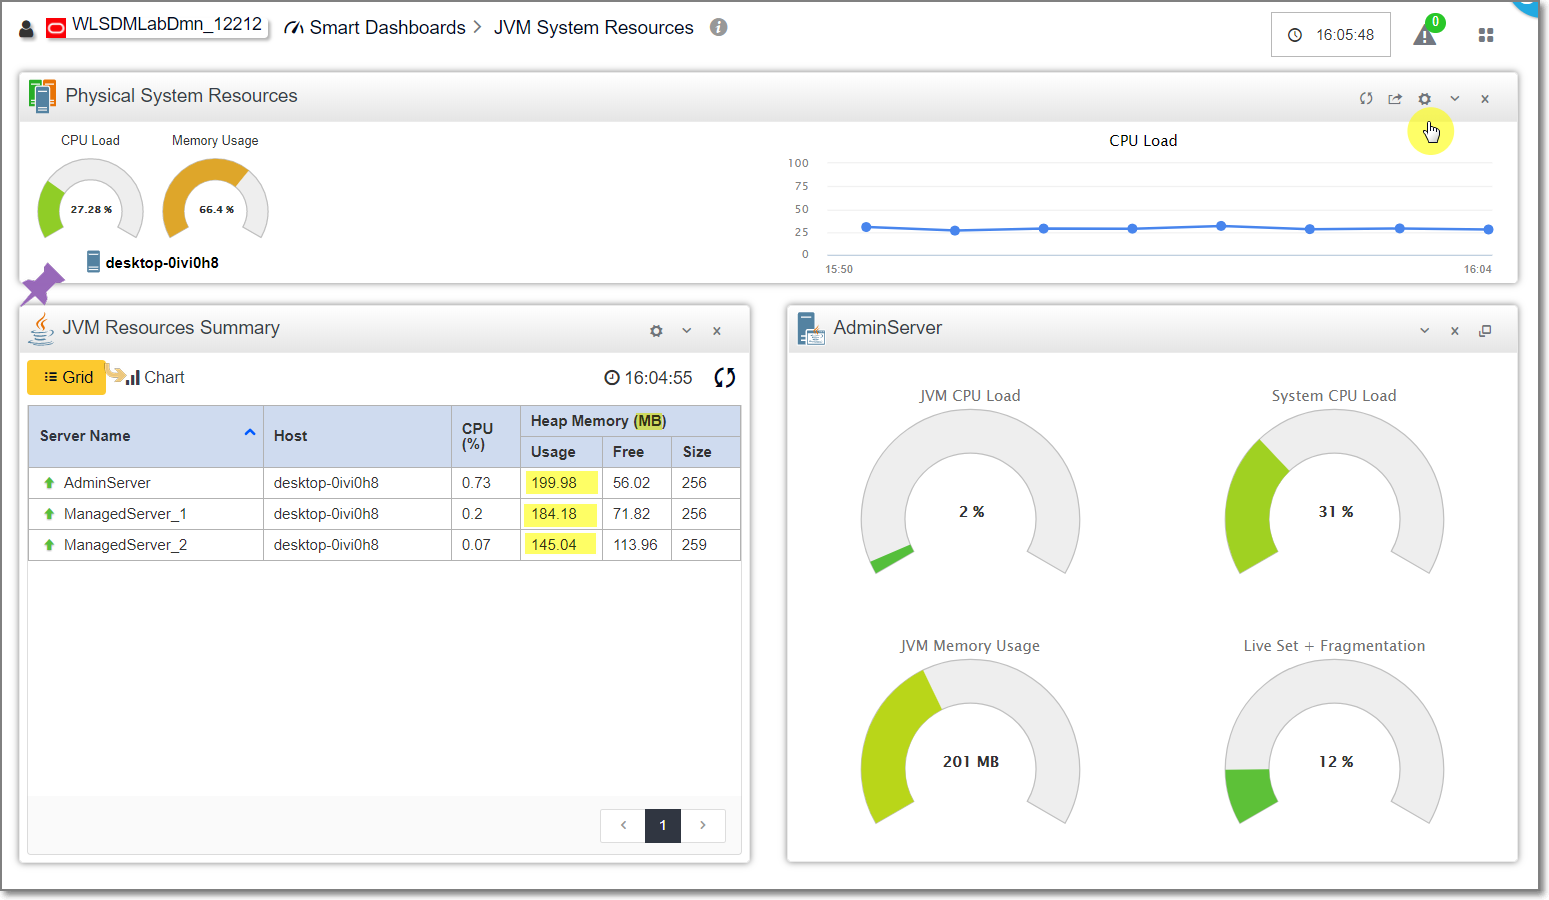
Performance metrics are standing in WLSDM menu's "JVM System Resources" tab. Users can add or delete to metric; dashboard, action;
configure alarm, store data or delete metric.


ProcessCpuLoad and SystemCpuLoad edit metric modal window:
ps: Yellow areas are default values.


Descriptions and more information about WLSDM JMX metrics as below
| Metric Name | Dashboard Category | Instance | Description |
|---|---|---|---|
| OpenSocketsCurrentCount | ServerRuntimeMBean | Provides methods for retrieving runtime information about a server instance and for transitioning a server from one state to another. | The current number of sockets registered for socket muxing on this server. |
| HoggingThreadCount | ThreadPoolRuntimeMBean | This bean is used to monitor the self-tuning queue | The threads that are being held by a request right now. These threads will either be declared as stuck after the configured timeout or will return to the pool before that. The self-tuning mechanism will backfill if necessary. |
| StuckThreadCount | ThreadPoolRuntimeMBean | This bean is used to monitor the self-tuning queue | Number of stuck threads in the thread pool. |
| PendingUserRequestCount | ThreadPoolRuntimeMBean | This bean is used to monitor the self-tuning queue | The number of pending user requests in the priority queue. The priority queue contains requests from internal subsystems and users. This is just the count of all user requests. |
| QueueLength | ThreadPoolRuntimeMBean | This bean is used to monitor the self-tuning queue | The number of pending requests in the priority queue. This is the total of internal system requests and user requests. |
| Throughput | ThreadPoolRuntimeMBean | This bean is used to monitor the self-tuning queue | The mean number of requests completed per second. |
| ProcessCpuLoad | OperatingSystemImpl | Information on the management interface of the MBean | ProcessCpuLoad |
| SystemCpuLoad | OperatingSystemImpl | Information on the management interface of the MBean | SystemCpuLoad |
| HeapFreePercent | JVMRuntimeMBean | Provides methods for retrieving information about the Java Virtual Machine (JVM) within with the current server instance is running. You cannot change the JVM's operating parameters while the JVM is active. Instead, use the startup options that are described in the JVM's documentation. The WebLogic JVM contains only one of these Runtime MBeans: If the JVM is an instance of a JRockit JDK, then the JVM contains JRockitRuntime MBean. Otherwise, it contains the JVMRuntimeMBean. | Percentage of the maximum memory that is free. |
| ActiveTransactionsTotalCount | JTARuntimeMBean | This interface is used for accessing transaction runtime characteristics within a WebLogic server. | The number of active transactions on the server. |
| TransactionRolledBackTotalCount | JTARuntimeMBean | This interface is used for accessing transaction runtime characteristics within a WebLogic server. | The number of transactions that were rolled back since the server was started. |
| ActiveConnectionsAverageCount | JDBCDataSourceRuntimeMBean | This class is used for monitoring a WebLogic JDBC Data Source and its associated connection pool. | Average number of active connections in this instance of the data source. Active connections are connections in use by an application. This value is only valid if the resource is configured to allow shrinking. |
| ActiveConnectionsCurrentCount | JDBCDataSourceRuntimeMBean | This class is used for monitoring a WebLogic JDBC Data Source and its associated connection pool. | The number of connections currently in use by applications. |
| ConnectionDelayTime | JDBCDataSourceRuntimeMBean | This class is used for monitoring a WebLogic JDBC Data Source and its associated connection pool. | The average amount of time, in milliseconds, that it takes to create a physical connection to the database. The value is calculated as summary of all times to connect divided by the total number of connections. |
| FailedReserveRequestCount | JDBCDataSourceRuntimeMBean | This class is used for monitoring a WebLogic JDBC Data Source and its associated connection pool. | The cumulative, running count of requests for a connection from this data source that could not be fulfilled. |
| LeakedConnectionCount | JDBCDataSourceRuntimeMBean | This class is used for monitoring a WebLogic JDBC Data Source and its associated connection pool. | The number of leaked connections. A leaked connection is a connection that was reserved from the data source but was not returned to the data source by calling close(). |
| WaitingForConnectionCurrentCount | JDBCDataSourceRuntimeMBean | This class is used for monitoring a WebLogic JDBC Data Source and its associated connection pool. | The number of connection requests waiting for a database connection. |
| ConnectionsCurrentCount | JMSRuntimeMBean | This class is used for monitoring a WebLogic JMS service. | The current number of connections to WebLogic Server server. |
| MessagesCurrentCount | JMSServerRuntimeMBean | This class is used for monitoring a WebLogic JMS server. | The current number of messages stored on this JMS server. This number does not include the pending messages. |
| MessagesPendingCount | JMSServerRuntimeMBean | This class is used for monitoring a WebLogic JMS server. | The current number of messages pending (unacknowledged or uncommitted) stored on this JMS server. Pending messages are over and above the current number of messages. |
| OpenSessionsCurrentCount | WebAppComponentRuntimeMBean | Describes a servlet component (servlet context). | Provides a count of the current total number of open sessions in this module. Returns the current total number of open sessions in this component. |
| CompletedRequests | WorkManagerRuntimeMBean | WorkManager Runtime information. | The number of requests that have been processed, including daemon requests. |
| PendingRequests | WorkManagerRuntimeMBean | WorkManager Runtime information. | The number of waiting requests in the queue, including daemon requests. |
| StuckThreadCount | WorkManagerRuntimeMBean | WorkManager Runtime information. | The number of threads that are considered to be stuck on the basis of any stuck thread constraints. |
Download Latest WLSDM for WebLogic 11g, 12c and 14c
DOWNLOAD WLSDM NOWWLSDM is FREE*
- Latest Version: v4.1.2 Watch WLSDM Trailer
- Quick Installation Guide: Available in ZIP package as README.html
- Online Documentation: Available in ZIP package as WLSDM-HELP.html
