WLSDM Smart Dashboards
WLSDM Dashboard Pages And Metrics
2025/07/29
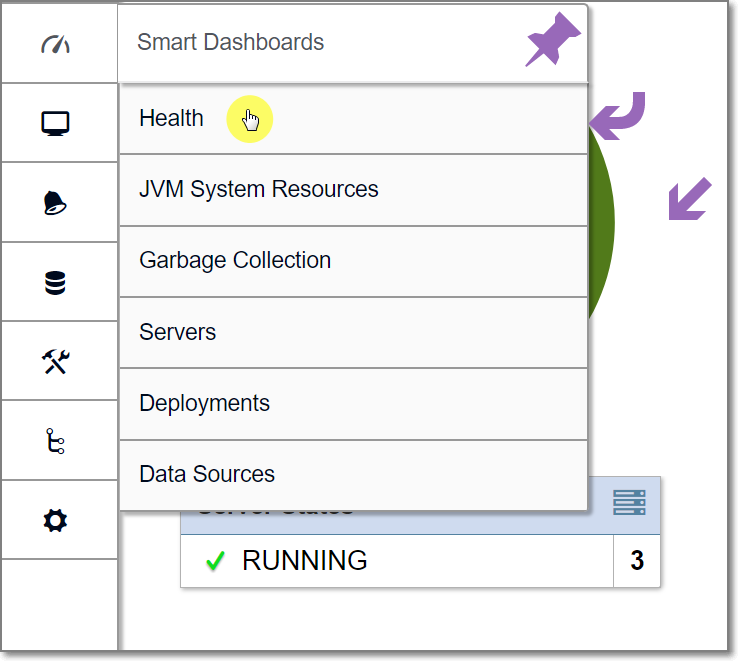
Smart Dashboards
- Health
- JVM System Resources
- Garbage Collection
- Servers
- Deployments
- Data Source
- JVM Servers

Health monitoring
WLSDM notifies user when health change.Notification page shows currently and historical health
Can Monitor
-Server Healths
-Datasource healths
-Deployment healts
-JMS Server healths
JVM System Resources
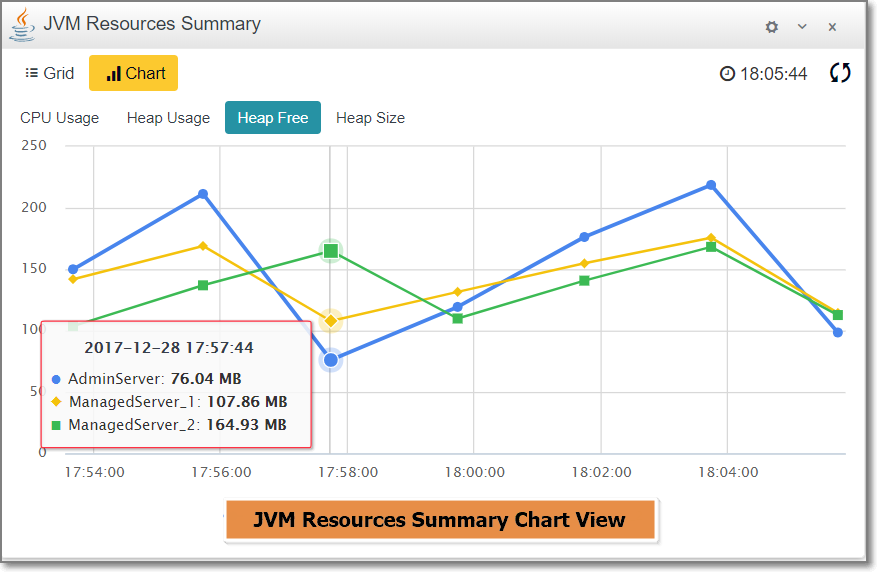
This dashboard is able to monitor physicalMemoryUsage and systemCpuLoad
Alarm set threshold and store data features are available on physicalMemoryUsage and systemCpuLoad metrics
JVM System Resources dashboard page has two display option: grid and chart


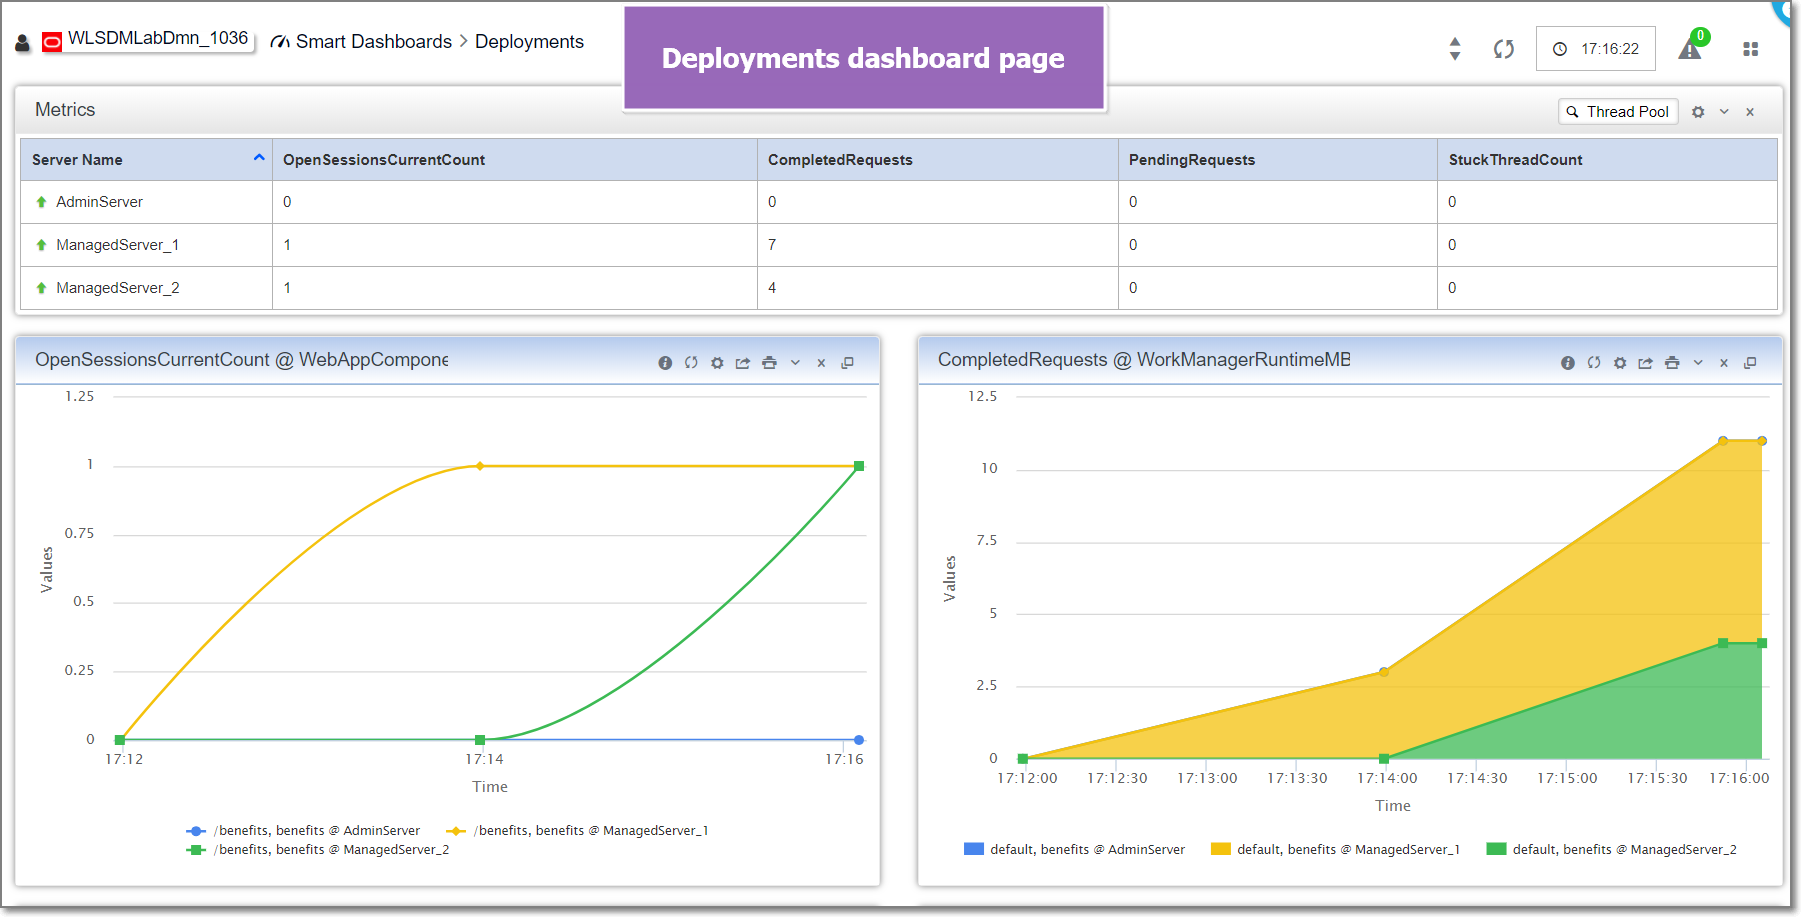
Deployments Dashboard Page
Available deployments metrics as below:
Instance DescriptionDescribes a servlet component (servlet context).
Deprecation of MBeanHome and Type-Safe Interfaces
This is a type-safe interface for a WebLogic Server MBean, which you can import into your client classes and access through weblogic.management.MBeanHome.
As of 9.0, the MBeanHome interface and all type-safe interfaces for WebLogic Server MBeans are deprecated.
Instead, client classes that interact with WebLogic Server MBeans should use standard JMX design patterns in which clients use the javax.management.
MBeanServerConnection interface to discover MBeans, attributes, and attribute types at runtime.>
- OpenSessionsCurrentCount:
- CompletedRequests
- PendingRequests
- StuckThreadCount

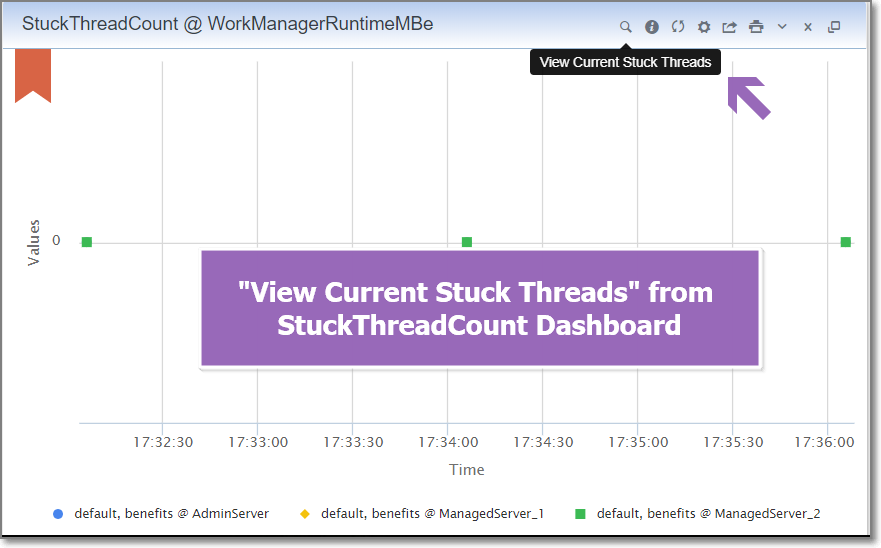
If StuckThreadCount > 0 users can view stuck threads as below

Download Latest WLSDM for WebLogic 11g, 12c and 14c
- Latest Version: v4.1.2 Watch WLSDM Trailer
- Quick Installation Guide: Available in ZIP package as README.html
- Online Documentation: Available in ZIP package as WLSDM-HELP.html
