WLSDM ReadMe
v3.4.2 | Released on 2018.09.22I. License
The license agreement (EULA) can be found on wlsdm-license.txt page which is located in "lic" folder
II. Package Directory Layout
$wlsdm_package.zip file contains following directories and files:
| war | contains wlsdm.war which is the main installation file and WebLogic Smart Dashboard & Monitoring Console extension |
| jar | contains wlsdm_agent.jar file which is the WLSDM agent for the operational actions. Must be add to the server's JVM arguments |
| docs | contains the help documents for WLSDM |
| lic | contains license information files. wlsdm-license.html and other 3rd party license information files |
III. Prerequisites
- Senior or Junior WebLogic Administrator. *WLSDM custom action is recommended for Senior (Advanced) WebLogic Administrators!
- Mission critical WebLogic domain
- SMTP/Mail server information and SMTP relay for the server which WebLogic Admin Server is running. Highly recommended!
WLSDM improves administrative and DevOps WebLogic knowledge and skills.
Use " / info" icons for MBean explanations and descriptions on WLSDM console
Your WLSDM Solution Requires:
- NO additional physical servers (machine)
- NO additional database
- NO additional CPU, memory
- NO additional operational cost... etc.
IV. Installation
Easy installation!
- Add wlsdm_agent.jar to managed servers' JVM Arguments ${JAVA_OPTIONS}*
- Copy wlsdm.war file to WebLogic domain's console-ext folder
- (Re)start WebLogic admin server and managed server(s)
- That's all! WLSDM console will deploy automatically
- Login to WLSDM Console then complete configuration wizard for once
- Start proactive monitoring and move forward your WebLogic management infrastructure and team!
WLSDM Installation Best Practice Architecture

Quick Step by Step Installation Guide
 1. copy $wlsdm_package/jar/wlsdm_agent.jar to /path/to/wlsdm_agent.jar on the managed server machine(s)

            [user@machine]$ mkdir $DOMAIN_HOME/wlsdm_agent
            [user@machine]$ cp $wlsdm_package/jar/wlsdm_agent.jar $DOMAIN_HOME/wlsdm_agent/wlsdm_agent.jar
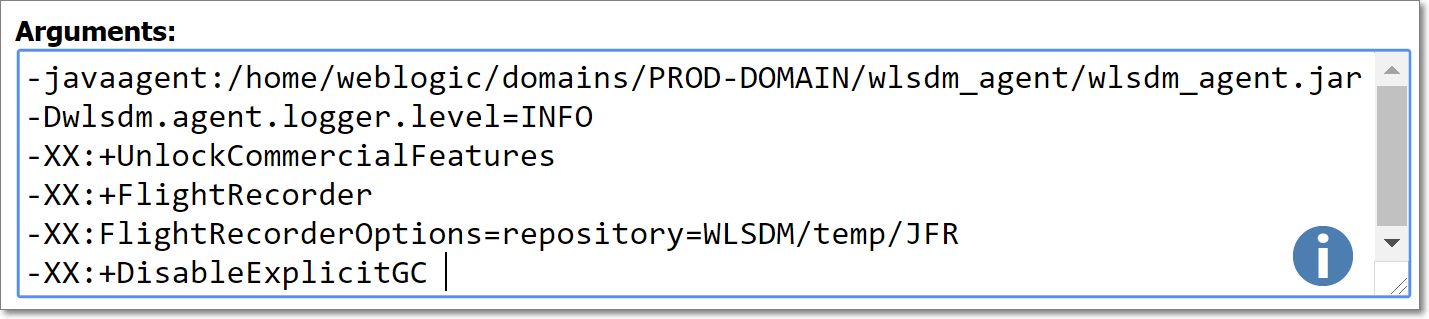
2. add wlsdm_agent.jar to WebLogic managed server´s JVM Arguments as below: --> *${JAVA_OPTIONS}
(Consider above best practice architecture and add wlsdm_agent.jar for the chosen WebLogic managed server(s)...) Note: Choose appropriate option according to your WebLogic environment. Replace "/path/to" with absolute folder path and keep "WLSDM/temp/JFR" as relative path! *2.1. JRockit and JDK 1.6: Add the following WLSDM JVM parameters to WebLogic managed servers´ JVM Arguments; JRockit: -javaagent:/path/to/wlsdm_agent.jar -Dwlsdm.agent.logger.level=INFO -XX:FlightRecorderOptions=repository=WLSDM/temp/JFR -XX:+DisableExplicitGC JDK 1.6: -javaagent:/path/to/wlsdm_agent.jar -Dwlsdm.agent.logger.level=INFO -XX:+DisableExplicitGC *2.2. Lower JDK 1.7.0_40: Add the following WLSDM JVM parameters to managed servers´ JVM Arguments; -javaagent:/path/to/wlsdm_agent.jar -Dwlsdm.agent.logger.level=INFO -XX:+DisableExplicitGC *2.3. JDK 1.7.0_40 and Higher and JDK 1.8: Add the following WLSDM & JFR JVM parameters to managed servers´ JVM Arguments; -javaagent:/path/to/wlsdm_agent.jar -Dwlsdm.agent.logger.level=INFO -XX:+UnlockCommercialFeatures -XX:+FlightRecorder -XX:FlightRecorderOptions=repository=WLSDM/temp/JFR -XX:+DisableExplicitGCWebLogic AdminServer and WLSDM Agent: Do NOT install wlsdm_agent.jar to WebLogic AdminServer. Never add wlsdm_agent.jar JVM arguments to AdminServer startup scripts (startWebLogic.sh or setDomainEnv.sh) otherwise WLSDM throws ERROR and WebLogic AdminServer fails to start. Or use if statements in the scripts to bypass AdminServer JVM argument assertion. When WebLogic AdminServer fails to start then consider this case and simply remove wlsdm_agent.jar arguments from AdminServer startup script
  GC JVM Argument Info: By default calls to System.gc() are enabled (-XX:-DisableExplicitGC). WLSDM uses and recommends -XX:+DisableExplicitGC to disable calls to System.gc() for better RMI performance. Remember, with or without this parameter JVM/WebLogic still performs garbage collection when necessary. This is a useful JVM argument to keep WebLogic managed servers GC safe and also can be add to Admin Server, too. For more information: http://www.oracle.com/technetwork/articles/java/vmoptions-jsp-140102.html

   Known Issue-1: After the complete WLSDM installation if the "Smart Dashboards > JVM System Resources" page is not working well and does not show the metric values properly then add "-Djavax.management.builder.initial=weblogic.management.jmx.mbeanserver.WLSMBeanServerBuilder" JVM argument to the relevant Managed Server(s) and restart the server(s).
How to add WLSDM JVM Parameters to WebLogic managed server arguments? (If you know how to add JVM arguments to WebLogic then skip to step 3) a) With WebLogic NodeManager: to instrument managed server instances started and stopped through the Node Manager, use the administration console
from the administration console, navigate to "Environments > Servers > (select your server) > Server Start > Arguments" add the above suitable JVM entry to Arguments section and save the page:
Environments > Servers > (select your server) > Server Start > Arguments
b) Without WebLogic NodeManager: add the following entry (add before Java executes) to the "startManagedServer" file UNIX / LINUX / MAC OS X:"startManagedServer.sh"export JAVA_OPTIONS="$JAVA_OPTIONS -javaagent:/path/to/wlsdm_agent.jar -Dwlsdm.agent.logger.level=INFO -XX:+UnlockCommercialFeatures -XX:+FlightRecorder -XX:FlightRecorderOptions=repository=WLSDM/temp/JFR -XX:+DisableExplicitGC"WINDOWS:"startManagedServer.cmd"set JAVA_OPTIONS=%JAVA_OPTIONS% -javaagent:"C:\path\to\wlsdm_agent.jar" -Dwlsdm.agent.logger.level=INFO -XX:+UnlockCommercialFeatures -XX:+FlightRecorder -XX:FlightRecorderOptions=repository=WLSDM/temp/JFR -XX:+DisableExplicitGCNOTE: there is no need to install "wlsdm_agent.jar" to the WebLogic Admin Server!
3. (re)start WebLogic managed server(s) which wlsdm_agent.jar is installed. after restarting managed server(s), below logs must be seen in managed server log files. this means WLSDM agent is deployed successfully ManagedServer Log:<Mar 4, 2015 1:13:24 PM PDT> <Info> <WLSDM> <BEA-000000> <WLSDM agent loaded successfully. Version: v3.4.2> <Mar 4, 2015 1:13:24 PM PDT> <Info> <WLSDM> <BEA-000000> <RJVM operation is bound in the registry with the name wlsdm_agent_remote_operation.>
4. copy $wlsdm_package/war/wlsdm.war to ${WEBLOGIC_DOMAIN_HOME}/console-ext/. folder on the admin server machine
5. then (re)start WebLogic admin server. that is all, WLSDM console will deploy automatically after restarting admin server, below logs must be seen in admin server log files this means WLSDM console is deployed successfully and WLSDM console is ready to monitor WebLogic domain AdminServer Log:<Mar 4, 2015 1:12:12 PM PDT> <Info> <WLSDM> <BEA-000000> <WLSDM console deployed successfully. Version: v3.4.2> <Mar 4, 2015 1:12:12 PM PDT> <Info> <WLSDM> <BEA-000000> <WLSDM garbage collection monitoring initialized successfully.> <Mar 4, 2015 1:12:12 PM PDT> <Info> <WLSDM> <BEA-000000> <WLSDM metric monitoring initialized successfully.> <Mar 4, 2015 1:12:12 PM PDT> <Info> <WLSDM> <BEA-000000> <WLSDM health monitoring initialized successfully.> <Mar 4, 2015 1:12:12 PM PDT> <Info> <WLSDM> <BEA-000000> <WLSDM performance monitoring initialized successfully.> <Mar 4, 2015 1:12:12 PM PDT> <Info> <WLSDM> <BEA-000000> <WLSDM back-end monitoring initialized successfully.> <Mar 4, 2015 1:12:12 PM PDT> <Info> <WLSDM> <BEA-000000> <WLSDM data archiver initialized successfully.> <Mar 4, 2015 1:12:12 PM PDT> <Info> <WLSDM> <BEA-000000> <WLSDM custom DevOps MBean handler initialized successfully.> <Mar 4, 2015 1:12:12 PM PDT> <Info> <WLSDM> <BEA-000000> <WLSDM job scheduler initialized successfully.>
 6. make sure all your WebLogic domain resources (wl servers, deployments, data sources, jms servers... etc.)
    are RUNNING and ACTIVE
 7. access WLSDM console
     How to access WLSDM console?
 8. complete WLSDM quick configuration wizard carefully according to WebLogic domain characteristic
     How to complete WLSDM wizard?
Installation and Introduction Video Tutorial
These installation tutorials also contains basic information about WLSDM console usage;
Newest | Installation on JCS and Console Usage Tutorial (Linux / Same as On-Premise):
WLSDM Installation: On Oracle JCS (Java Cloud Service) PaaS or On-Premise
Old Version | Local Installation and Usage Tutorial (Windows / Old Version - Still Valid):
How to install and use WLSDM?
V. Accessing WLSDM Console
After the installation, login to WebLogic admin console then WLSDM portlet will be visible in WebLogic domain structure
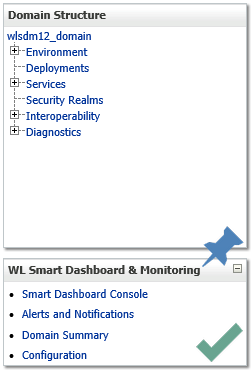
Click "Smart Dashboard Console" on WLSDM menu
OR
Type WLSDM URL on browser's address bar for accessing directly
http:// $ADMIN_SERVER_IP : $PORT /console/WLSDM
https:// $ADMIN_SERVER_IP : $PORT /console/WLSDM
VI. Console Usage & DevOps MBean
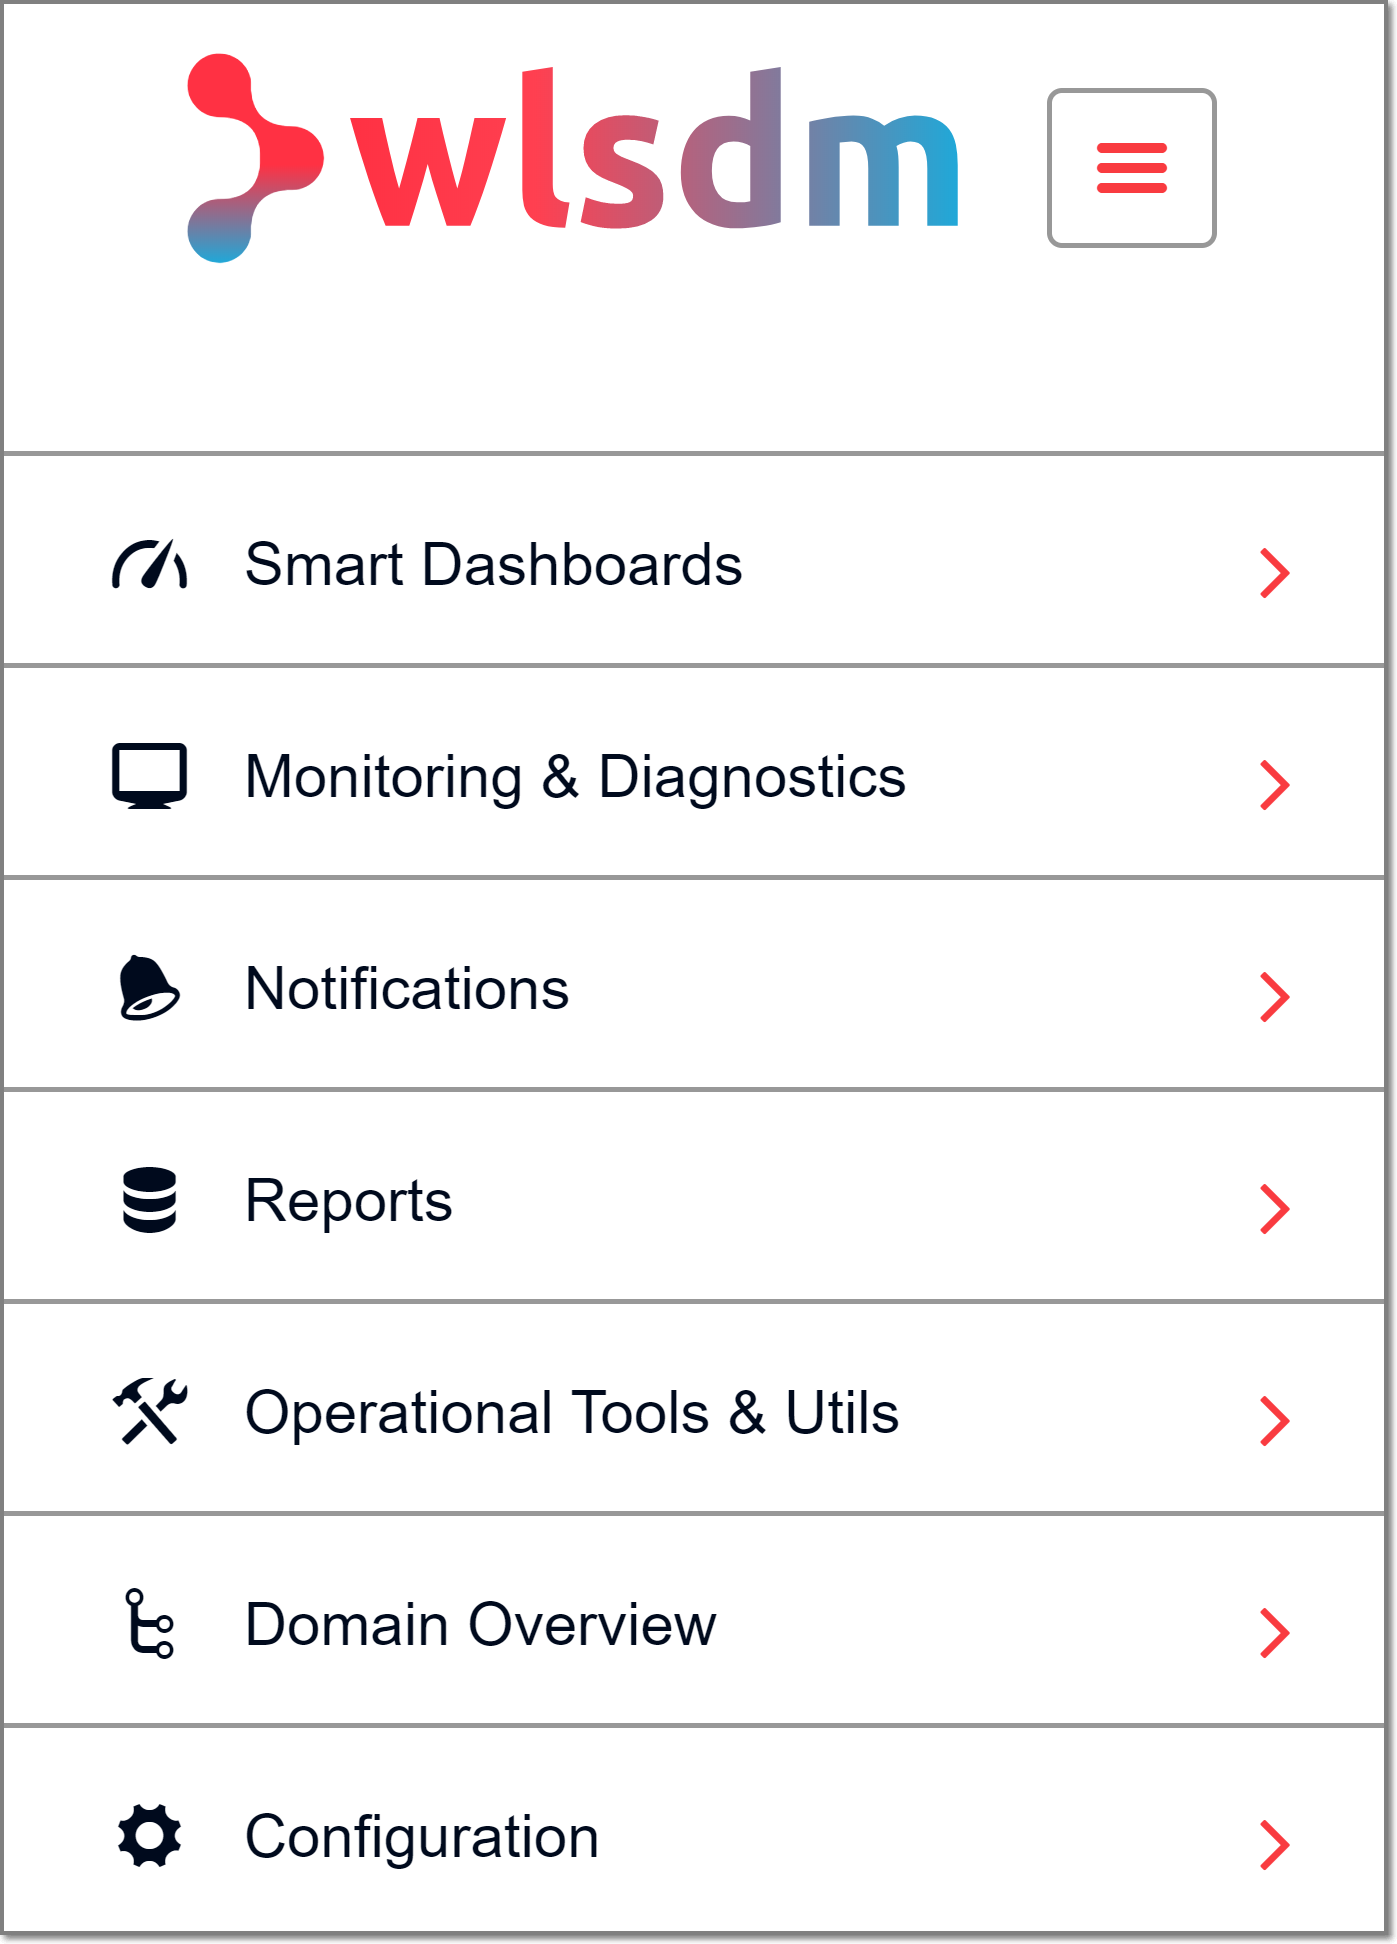
Main WLSDM menu is located on the left side and default is collapsed. It can be expand/collapse by menu icon
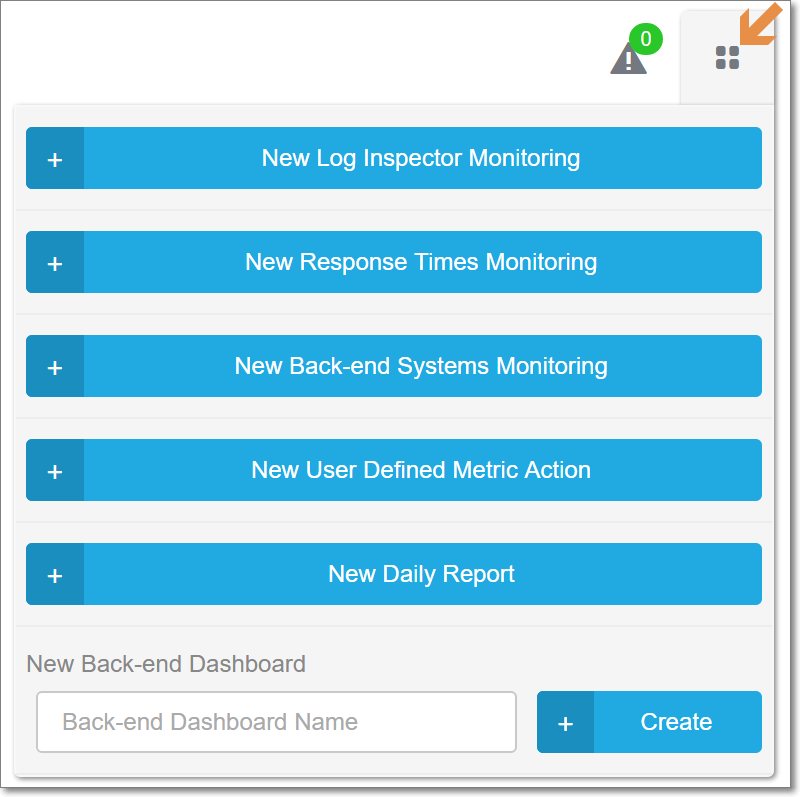
Page operations icon is located on the right top of every pages. Visual page settings and page functions can be listed on page operations menu
WLSDM Console has "Quick Tour" for the first login. WLSDM Console usage is very easy and user friendly. Just follow "quick tour" steps!
Visit all WLSDM default dashboards, pages and discover WLSDM console features. Especially "Operational Tools & Utils" pages will increase interactivity between Administrator/Developer/DevOps and WebLogic Domain. Enjoy your "Native WebLogic Monitoring and Diagnostic" solution.
Transform all kind of scripts to JMX MBeans
Go to "Configuration > Monitoring & Diagnostics > Generic DevOps MBeans (tab)" page.
Use Generic DevOps MBean functionality and never miss any detail about WebLogic domain environment. Export the DevOps scripts and share with team members. Do not let valuable scripts have lost in CRON jobs.
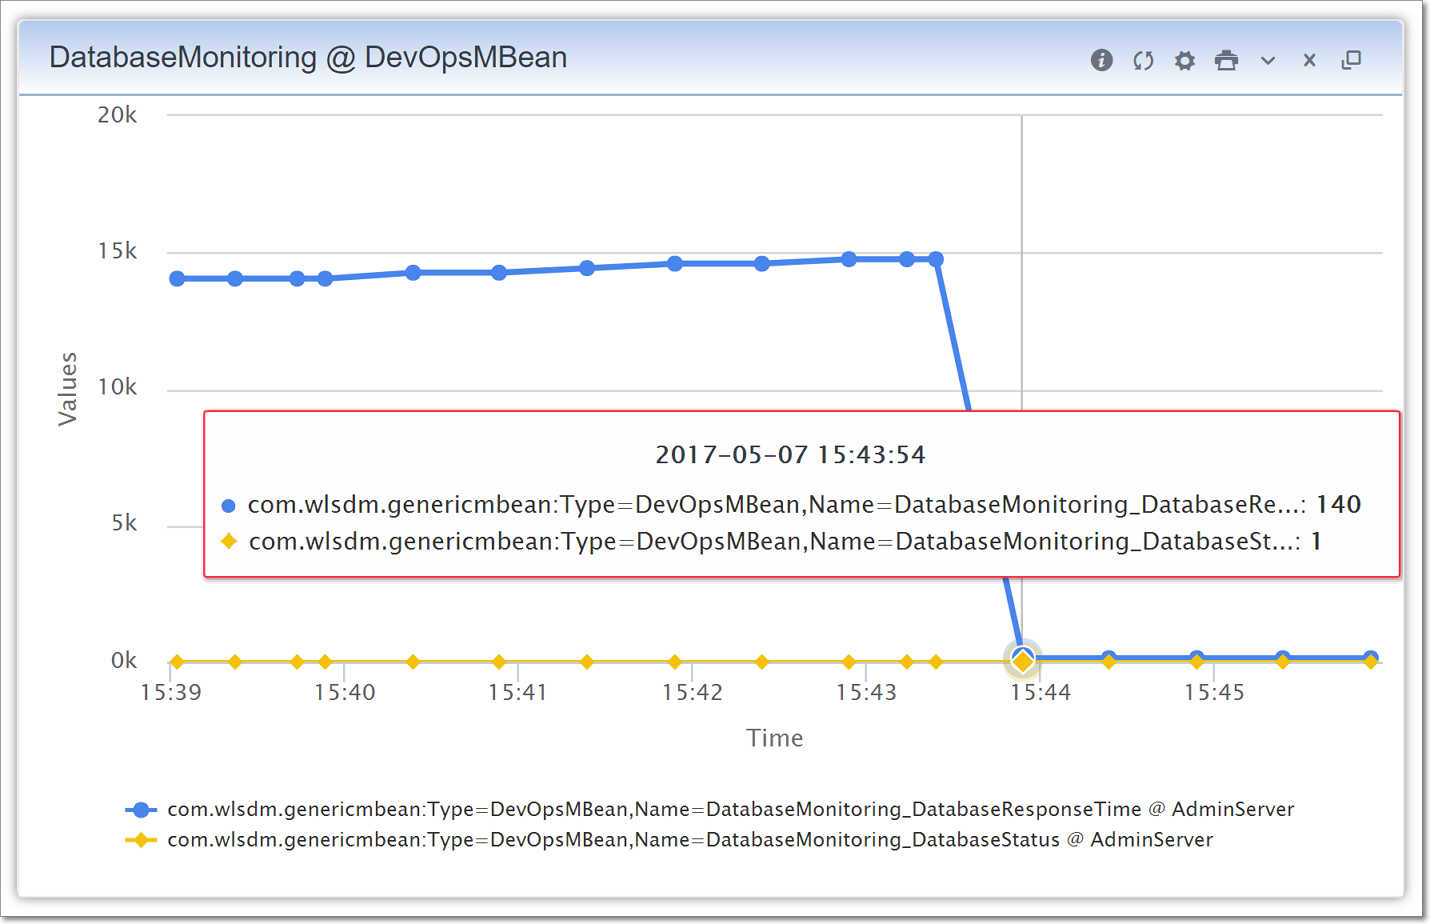
This feature is named as DevOps MBean to increase the interactivity between WebLogic domains and deployed applications. It is possible to monitor i.e. Waiting orders, logged in user count, 3rd party webservice invocation response times... etc.
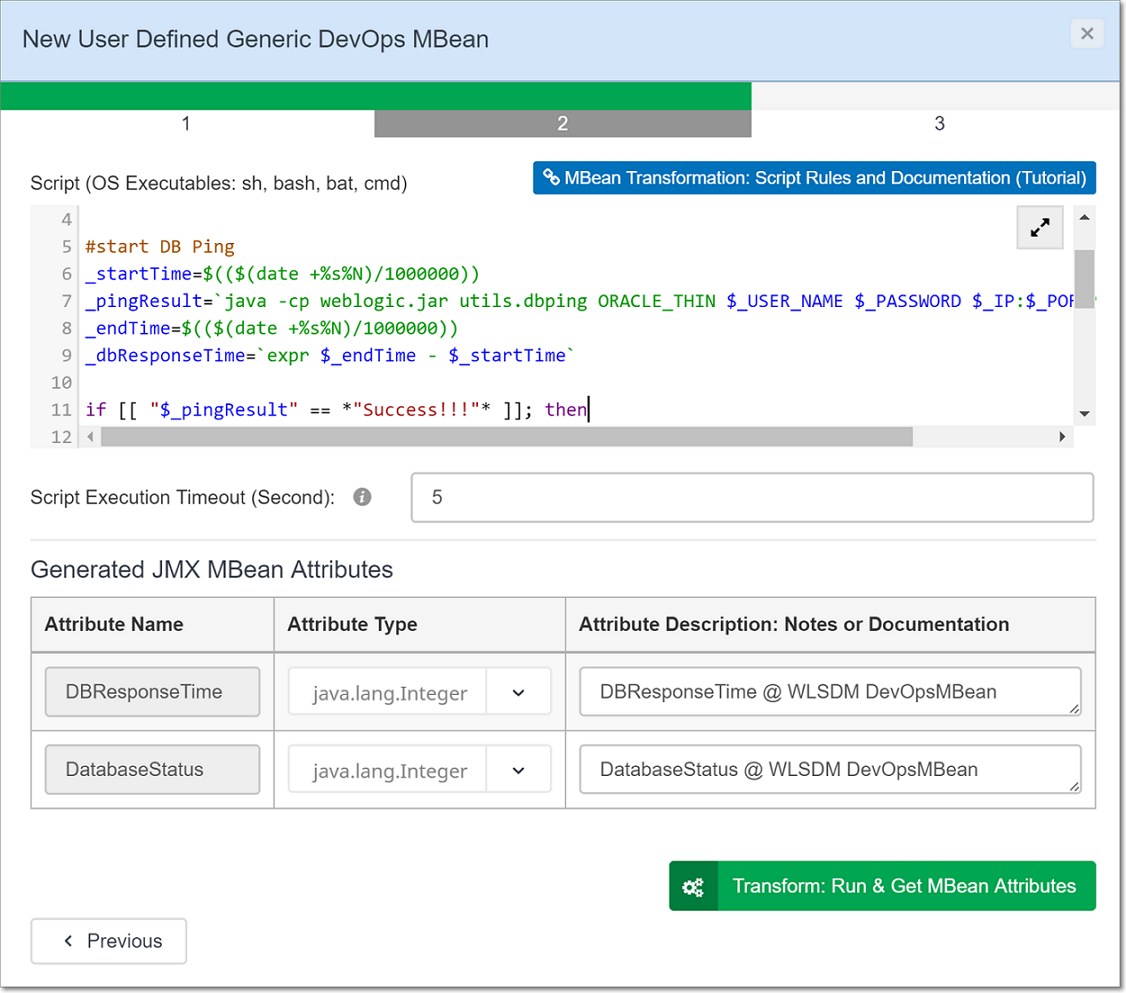
The left screen capture at below is the script part and the right screen capture is the Output on the assigned custom dashboard. Totally parametric and supports to define custom actions for the assigned threshold.
Step-1 Write Shell Script: Ping database and calculate database response time using WebLogic API (weblogic.jar)
#Author: WLSDM | 2017

#Variables
_dbStatus=0
#0:DB_DOWN,1:DB_UP

#start DB Ping
_startTime=$(($(date +%s%N)/1000000))
_pingResult=`java -cp weblogic.jar utils.dbping ORACLE_THIN $YOUR_USER_NAME $YOUR_PASSWORD $YOUR_IP:$YOUR_PORT/$YOUR_SERVICE_NAME`
_endTime=$(($(date +%s%N)/1000000))
_dbResponseTime=`expr $_endTime - $_startTime`

if [[ "$_pingResult" == *"Success!!!"* ]]; then
  _dbStatus=1
  #echo "Database connection SUCCESS!!!"
  #DB_UP
  echo DatabaseStatus=$_dbStatus
else
  _dbStatus=0
  #echo "Database connection FAILURE!!!"
  #DB_DOWN
  echo DatabaseStatus=$_dbStatus
fi
echo DatabaseResponseTime=$_dbResponseTime
Shell Script Output:
DatabaseStatus=1
DatabaseResponseTime=1218
Step-2 Use WLSDM Generic DevOps MBean Wizard
"User Defined Generic DevOps MBean" wizard is availabe on "Configuration > Monitoring & Diagnostics" page. List records on "Generic DevOps MBeans" tab and use "New Generic DevOps MBean" button from "Page Operations" menu to open the wizard.
- More information about WLSDM DevOps MBean is available on the documentation page: Generic DevOps MBean
- SQL MBean Transformation on WebLogic: Screencast
VII. Upgrade & Reinstall & Uninstall
Easy upgrade!
- Replace wlsdm_agent.jar file with the new release and keep wlsdm_agent.jar JVM arguments. *($JAVA_OPTIONS)
- Replace wlsdm.war file with the new release to WebLogic domain's console-ext folder
- (Re)start WebLogic managed server(s) then admin server
- That's all! WLSDM will be upgraded after restart processes
Fresh Re-installation!
- Replace wlsdm_agent.jar file with the new release and keep wlsdm_agent.jar JVM arguments. *($JAVA_OPTIONS)
- Shutdown admin server
- Delete $DOMAIN_HOME/WLSDM runtime folder
- Replace wlsdm.war file with the new release to WebLogic domain's console-ext folder
- Start WebLogic admin server and restart managed server(s) which wlsdm_agent.jar installed
- That's all! WLSDM will be reinstalled after restart processes
- Complete WLSDM configuration wizard
How to uninstall?
- Remove wlsdm_agent.jar JVM arguments on Managed Server(s) if it is installed then restart relevant WebLogic Managed Server(s)
- Shutdown admin server
- Delete WLSDM runtime folder: ${WEBLOGIC_DOMAIN_HOME}/WLSDM/
- Delete wlsdm.war file: ${WEBLOGIC_DOMAIN_HOME}/console-ext/wlsdm.war then start WebLogic admin server
VIII. Monitoring Admin Server
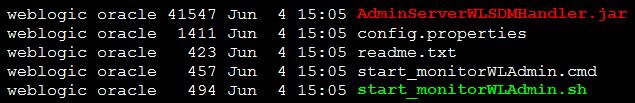
WLSDM offers complete monitoring infrastructure for WebLogic Application Server. monitorWLAdmin is a simple "Plug & Play" standalone application for monitoring WebLogic Admin Server externally. After the WLSDM installation and wizard setup completion, standalone monitorWLAdmin application will appear in runtime WLSDM folder as below content
$DOMAIN_HOME/WLSDM/monitorWLAdmin Folder Contents:
How to start?
Unix/Linux: nohup ./start_monitorWLAdmin.sh &
How does monitorWLAdmin work?
It monitors WebLogic Admin console periodically. When "Admin Server" goes down or slows down monitorWLAdmin sends alarm notification instantly
IX. Documentation & Community
Help is available
- on the "Help" page of WLSDM console at WebLogic domain Help page Console URL:
http(s)://$IP:$PORT/console/WLSDM/consolehelp/index - at HTML page in "$wlsdm_package/docs" directory. Open WLSDM-HELP.html
- online at http://www.wlsdm.com/docs/help
X. WebLogic Monitoring Tutorials
Installation and Console Usage: Oracle JCS (Java Cloud Service) or On-PremiseYouTube Tutorial (Newest)
How to install and use WLSDM?
YouTube Tutorial (Old Version)
WebLogic Health Monitoring Tutorial (+Voice)
YouTube Tutorial
WebLogic JVM System Resources Dashboard Tutorial (+Voice)
YouTube Tutorial
WebLogic JMX MBean Metric Monitoring (+Voice)
YouTube Tutorial
Advanced WebLogic Monitoring and Automation:
Develop JMX MBeans (YouTube Tutorial, Sample JAVA Code, Documentation)
How to get WebLogic thread dump continuously?
Continuous WebLogic Thread Dump Tutorial
WLSDM Dashboard Usage
YouTube Tutorial
Actions (Thread Dump, Heap Dump, Java Flight Recorder (JFR), WLDF Image)
YouTube Tutorial
JMX MBean Metric Browser & Email Notifications
YouTube Tutorial
Application Response Times & Log Inspector
YouTube Tutorial
How to Monitor Oracle DB ACTIVE/INACTIVE Sessions on WebLogic?
YouTube Tutorial
Monitor Back-end WebService Response Times with CURL on WebLogic:
Generic DevOps MBean: CURL Script, Download DevOps MBean Export, Sample Request
Monitor Every LOG/Text File On WebLogic:
WebLogic Log Monitoring Screencast
XI. Follow Us!
Please follow us and get updates. Never miss a post about WebLogic monitoring issues!
Community / Support
BLOG Posts
Twitter Follow
YouTube Tutorials
LinkedIn Connect
Google+ Circle
Facebook Like
Instagram follow4follow :)
Email Send
XII. Change Log & Release Notes
v3.4.2 | Released on 2018.09.22
| v3.4.2 is a patch set release | |
| License page is giving error while applying official license for trial license expired installation. It was a cache issue and workaround is restarting WebLogic AdminServer. License cache issue is fixed | |
| New line char issue is fixed in embedded scripts for Solaris OS platforms | |
| SOA BPEL engine metric pop-up was not working for the edit operations. The BPEL metric edit issue is fixed. Workaround is editing on the "Metric Settings" page for the BPEL engine metrics | |
| If the generated thread dump is not a full thread dump, "Open With Thread Dump Analyzer" button is not visible anymore on "Profiling Dumps" pages and modal windows | |
| Space characters and white space chars are removed for the "User Defined Generic DevOps MBean" result set | |
| Data archiving module performance is improved and its functionality is changed and its working performance is increased | |
| WL-OPC v1.0.9 integrations and related improvements is reflected. | |
| Minor bug-fixes, customer request implementations... |
v3.4.1:
| v3.4.1 is an integration release. WLSDM is integrated with WL-OPC which is central WLSDM Operation and Notification Center product. Additionally, WLSDM is integrated with VOI (Volthread Outbound Inspector) which is a central outbound transaction monitoring product | |
| WLSDM is added to Volthread product stack. WLSDM has a brand new logo anymore | |
| WL-OPC (WLSDM Operation Center) support and integration is added. WLSDM is certified with WL-OPC | |
| VOI (Volthread Outbound Inspector) support and integration is added. WLSDM is certified with VOI | |
| HTTP/S outbound monitoring support is added | |
| Page authorizations are enriched to support L1/L2 teams | |
| Page authorizations redesigned. Configuration edit buttons and functionalities are removed for non-administrator users | |
| Expiration reminder e-mail is added for evaluation users | |
| Adding wlsdm_agent to WebLogic AdminServer is harmful. Protection is added. WLSDM blocks WebLogic AdminServer to start and throws error when wlsdm_agent.jar is added to AdminSever startup JVM arguments then AdminServer fails. More detail is available in README | |
| Current JMX MBean metric value is added to "Metric & Chart Options" modal window. It is more helpful while setting alarm thresholds | |
| Notification records are linked to the related monitoring configuration in the all notification pages | |
| MBean metric configuration shortcut is added to "Generic DevOps MBeans" configurations grid | |
| Information tool-tip is added to threshold field on "Physical Resources Metric Configuration" modal window on JVM System Resources page | |
| JVM and physical resources back-end monitoring engine is redesigned and improved | |
| Back-end and MBean metric report engine and report page performance is tuned and improved | |
| Client and server timezone problem is fixed and improved. In WLSDM console only server timezone is valid anymore | |
| Deleted/Removed WebLogic managed servers is being cleaned in JMX MBean Metric Browser page | |
| Closing modal windows when pressing ESC key is prevented | |
| OS canonical hostname resolve performance bottleneck is fixed. Caused by Meltdown and Spectre OS patch issues are tested and improved | |
| Deployments which targeted to VirtualHost are visible in Health Dashboard anymore. Health Dashboard was giving error and the problem is resolved | |
| Non-administrator users were unable to rename files in the file explorer page while uploading. Rename error is fixed | |
| MBean Metric report feature "Get Report From Daily Data" was returning only current day's data. Switched to last 24 hours data | |
| SOA module BPEL engine dashboard's metric option modal window UI problem is fixed | |
| In some cases scheduled jobs was not starting. ScheduledJobExecuter back-end startup time problem is fixed | |
| Top loading bar was always visible when no data found in the metric notification page. Loading bar stuck problem is resolved | |
| REMINDER: Customers who have a not valid yearly support license unable to do major upgrade. Warning is added | |
| Minor bug-fixes, continuous UX/UI improvements, customer request implementations... |
v3.2.3:
- v3.2.3 is a stabilizing release. Most of current features are more powerful anymore and some new features and enhancements are added
- Operational Notes (Acknowledge) feature is added to Metric Notifications page. Just add operational note to the metric notifications then publish it to other WebLogic administrators in a team
- Authorization settings and configurations are enhanced. WebLogic "None Administrator" security realm users able to use WLSDM "File Explorer" and "Log Viewer & Tailer" pages anymore. Just configure the settings and let other users (i.e. Developers) see and download WebLogic domain logs by themselves and upload any file to the server
- Scheduler module is enhanced. CRON history is added to scheduler module and WLSDM notifies failed jobs via email
- Changing file/folder permissions is added to File Explorer page
- Response Times monitoring is more robust and strong anymore. Tested with 300k requests per minutes for each WebLogic managed server and meanwhile WLSDM will send slow pages response times as usual with least overhead
- WLSDM Settings Import/Export feature is enhanced and able to transfer all "Monitoring & Diagnostics" settings
- Storing Garbage Collection metric data is supported anymore
- Open Metric Reports feature is added to Garbage Collection dashboard. Get WebLogic GC report historically
- WLSDM console static file sizes are decreased for improving Oracle Java Cloud Service experience
- Back-end "Reset to Default" buton is added. Back-end settings switches to default WLSDM back-end monitoring settings
- Major/Minor bug-fixes, extreme performance improvements and UX/UI improvements
v3.2.2:
- v3.2.2 is a customer enhancement and additional new features release
- WLSDM supports Oracle WebLogic Server 12.2.1.3 release
- Scheduler module is added. Add any kind of script then schedule it. Add "Quartz Cron Jobs" and visualize WebLogic CRON operations
- Downtime (WLSDM Monitoring) option is added. Add Downtime job and stop all WLSDM monitoring or notifications for the specified date/time interval automatically
- When "downtime is active" or "all the notifications are disabled" Notification icon blinks on every page
- Flight Recorder Repository (Auto JFRs) tab page is added to Profiling Dumps. Lists all auto created JFR files in one place. Download JFR files and open with Java Mission Control (JMC). Continuous WebLogic monitoring and historical diagnosing, troubleshooting. Identify occurred problems with old JVM snapshots
- Alert Generation/Decision Threshold property is added. WLSDM generates METRIC ALERT notification for the first valid occurrence by using this property with default '1' INHERIT setting. system.monitoring.metric.alarm.generation.alert.decision.threshold property is available in "WLSDM System Settings > system.monitoring (tab)" page
- Unlimited alarm notification delivery feature is added. system.monitoring.metric.alarm.generation.maximum.continuous.delivery.count property is available in "WLSDM System Settings > system.monitoring (tab)" page. (Default: 1, Minimum: 1, Maximum: 20, Unlimited: -1 (Unlimited alarm generation) )
- Known Issue: WLST Web Console page was not working for the WebLogic 12.2.1 release. This problem is resolved permanently and "WLST Web Console" works in every WebLogic release anymore. Supports latest WebLogic releases: 12.2.1.2 and 12.2.1.3
- WLSDM configuration export/import feature is more robust and able to export all the settings/definitions/records anymore
- JVM System Resources page is enhanced. Able to monitor machine/system CPU and Memory usage. Physical System Resources panel is added to page
- Garbage Collection Dashboard page is enhanced. Chart type can be changed. Scatter, Bar, Line options are available for the GC chart
- Notification modal window is redesigned and new features are added. Check notification window in every page
- Bulk "apply dashboard" and "apply action" operations are added to "Metric & Chart Options" window
- Open Metric Reports shortcut button is added to every chart in Smart Dashboards
- Dashboard delete operation is allowed anymore
- JMX MBean metric delete operation is allowed anymore
- ActiveConnectionsUsagePercentage custom MBean is added to data sources dashboard. Default alarm threshold value: 60%
- WebLogic console URL property is added for WLSDM HTML email notifications
- Logged in user information is added to every pages
- Back-end monitoring support is added to latest WebLogic 12.2.1.3 release
- Back-end event monitoring filter threshold property is added. Calculates only back-end events over threshold. Back-end monitoring performance is improved
- SOA Composite Deployed Trends email notification is enhanced. Email delivery canceled if there is no deployment for the previous check (optional)
- Custom Log Monitoring problem for Solaris OS platform is fixed
- Minor bug-fixes, performance and UI improvements
v3.1.2:
- v3.1.2 is a patch set release
- HTML footer is added to License page. Company signature and logo can be added as footer on HTML email notifications (available for registered products)
- Generic DevOps MBean edit options updated
- JFR FlightRecorder repository additional purge management is added
- Restart required managed servers are listed on wizard page for response times monitoring
- SOA module composite performance daily report wrong calculation defect is fixed
- Smart email delivery at LogInspector log monitoring defect is fixed
- Viewing Hogger and Stuck notifications stack trace problem is fixed
- Other minor bug-fixes, performance and UI improvements
v3.1.1:
- v3.1 is a major release and contains every detail of WebLogic monitoring and management
- Key feature Generic DevOps MBean is published as:
- Add any kind of scripts and transform them to JMX MBeans then visualize on smart dashboards. Supported scripts: sh, bash, cmd, bat, SQL...
- DevOps script integrations: Custom actions, alarm/threshold settings, reporting...
- Thread Pool monitoring is added to smart dashboards
- Identify HOGGER and STUCK thread on metric dashboards
- View HoggingThreadCount and StuckThreadCount threads on Metric Notification page
- View relevant HOGGER and STUCK log notifications on LogInspector
- Browser based WLSDM PUSH NOTIFICATION Service is added for all notification types. Simply click on it and solve the problem
- Notification actions are added to notification pages: View Threads, Go to Smart Dashboard, View Related Logs, Go to Reports...
- Garbage Collection Dashboard is added: Monitoring, Notification, Reporting, GC Log Viewing
- CPU sample (.npss) action is added to system defined actions
- Daily reports tab is added to Monitoring & Diagnostics page
- Back-end Systems Top Events and daily/weekly/monthly reports
- Response Times Top Requests and daily/weekly/monthly reports
- File Explorer: Web based file browser page and upload/download feature is added (CLOUD Feature)
- Custom Log Monitoring: Any type of file and log monitoring is available on LogInspector module
- WebLogic FMW Diagnostics Log and .OUT log monitoring support is added
- Full thread dump generation is added to agentless managed servers
- The whole WebLogic domain WLSDM system settings can be Exported/Imported. Export/Import feature is developed for multiple WLSDM installations with the same standard
- Chart ordering feature is added to smart metric dashboards
- Notification pages linked to every page on Notification dropdown menu
- Refreshing all metric value by one click is added to metric dashboards
- Performance Improvements: Tested on a production WebLogic domain which has more than 40 ADF managed servers successfully. Improved every page of WLSDM and all the heavy pages are loading faster and lower then 5 seconds
- UI/UX Improvements: We designed one of the best user interface for WebLogic monitoring by listening our community feedback
v2.5.2:
- FMW OSB Monitoring Module is released. (Supports 11g and 12c)
- WLSDM OSB Monitoring, Diagnostics & Report Modules
- OSB Smart Dashboards
- Monitoring ProxyService Performance
- Monitoring Deployed OSB Services Trend
- Summarizing OSB Service List & Endpoint URIs
- OSB Notifications and Alarms
- ProxyService Performance Notifications
- OSB Reports
- Reporting ProxyService Performance
- OSB Daily Reports (EMAIL)
- Daily OSB Report for ProxyService Performance
- Daily SOA Report for Deployed OSB Service Trend
- OSB Smart Dashboards
- WLSDM Core:
- "Health History" page is added. Has Grid and Timeline choice
- Performance improved for health monitoring & health dashboard
- Backend health data cache feature is enabled on health dashboard by default
- Webservice User Test Client does not exist warning is added to "Composite and Service URI" pages
- Bug-fixes, performance and UI improvements
v2.4.0:
- Enable Backend HEALTH Cache feature is added to Health Dashboard. Enable this feature for the domains which have too many resources or heavy page loads. WLSDM applies to backend HEALTH cache data for better performance
- Email notification recipients property is enriched. It is possible to send separate HEALTH and METRIC email notifications. Supports L1 and L2 operation teams
- Email addresses are collected as default email list. (Customer request)
- Email Group feature is added (Customer request)
- SMTP connection timeout property is added to system.wlsdm tab
- t3/JMX connection timeout property is added to system.wlsdm tab
- Bug-fixes, performance and UI improvements
v2.3.7:
- Bugs reported by community are fixed
- Performance improved for domains which have more than 40+ managed servers
- LogInspector WLDF query name is added to HTML alert emails
- UI improved with UX
v2.3.5:
- OutOfMemoryError log monitoring is added to Log Inspector
- Back-end dashboard infrastructure is improved and new features/events added:
- Able to create unlimited custom back-end dashboards
- Back-end Generic dashboard is added (All-in-one backend dashboard)
- JDBC Dashboard is added
- EJB (EJB Business Method Invoke) Dashboard is added
- Web Services (JAS-WS & JAX-RPC) Dashboard is added
- Socket I/O Dashboard (Socket Read&Write) is added
- File I/O Dashboard (File Read&Write) is added
- Email notification module is enriched
- Able to disable/enable all METRIC CLEAR emails. Default: ON
- Able to disable/enable all HEALTH CLEAR emails. Default: ON
- Able to disable/enable managed server health warning email notification. Default: OFF
- Able to disable/enable managed server transition states (STARTING, SUSPENDING, FORCE_SUSPENDING, RESUMING, SHUTTING_DOWN, SHUTDOWN_PENDING, SHUTDOWN_IN_PROCESS, FAILED_RESTARTING, FORCE_SHUTTING_DOWN) email notifications.
- Able to disable/enable deployment transition states (STARTING, SUSPENDING, FORCE_SUSPENDING, RESUMING, SHUTTING_DOWN, SHUTDOWN_PENDING, SHUTDOWN_IN_PROCESS, FAILED_RESTARTING, FORCE_SHUTTING_DOWN) email notifications. Default: ON
- Reset to default feature is added to notification settings.
- "Send Log as Email" feature is added to "Monitoring & Diagnostics > Log Inspector" page
- Alert icon is added to metric dashboards. MBean metric values over threshold blinks anymore (On Grid an Chart Headers)
- All SOA Report grid tables has export data feature as (Copy, CSV, Excel, PDF, Print) anymore
- All SOA Report charts support chart type selection (Line, Bar, Pie... etc.) anymore
- New alert HTML Templates is added and HTML email templates will be upgraded automatically
- Support License information is added to licenses and "Config > License" page
- "Free Developer Edition/License/Support/Evaluation" information badge is added to all pages
- WLSDM sends "Support License expiration warning" in remaining 7 days.
- Bug fixes and performance/UI/UX improvements
v2.3.1:
- FMW SOA Monitoring Module is released. (Supports 11g and 12c)
- WLSDM SOA Monitoring, Diagnostics & Report Modules
- SOA Smart Dashboards
- Monitoring BPEL Engine (Only 11g)
- BPEL Engine Dashboard (Historical - Only 11g)
- Monitoring Composite Performance
- Monitoring Callback and Invoke
- Monitoring Composite Faults
- Monitoring Deployed Composites Trend
- Summarizing Composite List & Endpoint URIs
- SOA Notifications and Alarms
- BPEL Engine Notifications
- Composite Performance Notifications
- Callback and Invoke (DLV_MESSAGE) Notifications
- Composite Faults and Errors Notifications
- SOA Reports
- Reporting SOA BPEL Engine
- Reporting SOA Composite Performance
- Reporting SOA Callback and Invoke (DLV_MESSAGE)
- Reporting SOA Composite Faults and Errors
- SOA Daily Reports (EMAIL)
- Daily SOA Report for Composite Performance
- Daily SOA Report for Callback and Invoke (DLV_MESSAGE)
- Daily SOA Report for Composite Faults and Errors
- Daily SOA Report for Deployed Composites Trend
- SOA Smart Dashboards
- WLSDM Core:
- Auto archive feature is added. Configurable and integrated archive module for all the stored data types
- JVM System Resources dashboard is renewed and enriched
- Monitor JVM CPU Load , Heap (Usage, Free, Size)
- Alarm / Notification feature is added to JVM Resources dashboard
- Grid and Chart feature is added
- Health dashboard is renewed and enriched
- Donut charts are added: Health States (WebLogic Servers, Deployments, Data Sources, JMS)
- Server state feature is enriched
- WebLogic server activation time and counter feature is added
- Deletion feature is added to "Monitoring & Diagnostics > Profiling Dumps" page. (Asynchronous file deletion for JFR, WLDF Diagnostic Image, HPROF, LOG)
- New "Operational Tools & Utils > MBean Search" page is added
- Search any text in WebLogic MBean Instance Type
- Search any text in WebLogic MBean Attribute Type
- Search any text in WebLogic MBean Instance Name
- Search any text in WebLogic MBean Attribute Name
- See all the WebLogic MBean attribute values on search results
- Compare WebLogic MBean attribute values
- New "Domain Overview > Timeout Values" page is added.
- WLSDM: Timeouts are the most important settings for keeping your WebLogic domain healthy, strong and responsive
- Important and Recommended WebLogic "Domain Timeouts" MBeans are listed with their values
- Important and Recommended WebLogic "JVM Timeouts" MBeans are listed with their values
- Important and Recommended WebLogic "Server Timeouts" MBeans are listed with their values
- Important and Recommended WebLogic "Data Source Timeouts" MBeans are listed with their values
- WebLogic Runtime JVM arguments and WebLogic console arguments values is added to "Domain Overview > Domain Summary" page
- WebLogic Domain Structure menu items are added as integrated and dynamic drop-down menu to all WLSDM pages
- WebLogic Admin Server monitoring plug&play application "monitorWLAdmin" is enriched
- General performance and error handling improvements
- Several bug fixes
v2.1.8:
- Bug-fixes and performance improvements
v2.1.7:
- Fresh installation is recommended instead upgrade
- Log Viewer page is enriched
- Back-end monitoring performance improved
- Fetching WebLogic Server log and Response Time records are limited parametrically
- Log Inspector Email Notifications can be continuous or daily once
v2.1.5:
- Monitor WLSDM Agents page is added
- Shutdown servers blink on JVM System Resources dashboard
- Adding User Defined (Log) File feature is added to Log Viewer page
- Send Log Content as HTML EMAIL feature is added to Log Viewer page
- Viewing and filtering weblogic.Stdout and weblogic.Stderr log files
v2.1.1:
- System Resources generic dashboard is added
- Log Viewer page is added to "Operational Tools". View and tail every log file on WLSDM console
v2.0.0:
- Free Developer Edition (Fully Featured) - WLSDM can be used by developers for free!
- WLSDM Quick installation Wizard is more robust anymore. Monitoring & Diagnostics step is added
- Suggest Button for Metric Thresholds on Wizard pages
- Get manual profiling dumps for JFR, Thread Dump, WLDF Diagnostic Image and Heap Dump
- Self-Tuning Thread Pool Threads detail is added for HoggingThreadCount and StuckThreadCount EMAIL notifications
-
Back-end system monitoring
- JDBC Executement Statement
- Webservices JAXWS Endpoint
- EJB Business Method Invoke
- Back-end Reports page is added
- Operational Tools section is added
- WLST Web Console Page
- Storing and Executing WLST Scripts
- Thread Dump Analyzer Page
- Decrypt-Encrypt Page
- Notifications are enriched
- Metric Notifications
- Log Inspector Notifications
- Response Times Notifications
- Back-end Systems Notifications
- Enable/Disable Global Notifications for EMAIL and SNMP By One By
- Enable/Disable All EMAIL-SNMP Notifications feature is added
- SNMP Notification feature is added. Easy SNMP trap configuration:
- SNMP Trap for WebLogic State and Health (Servers, Deployments, Data Sources and JMS)
- SNMP Trap MBean Metric Values
- SNMP Trap for WebLogic Server Logs
- Test SMTP and SNMP settings operations are added to Configuration > System page
- Log Inspector WLDF snippets are added
- Dead Lock
- Heap Space
- Stuck Thread
- Unchecked Exception
- General Severity Error
- WebLogic Domain Summary Page is added
- Data source passwords are listed on domain summary page (Decrypted and Encrypted) - All users are forbidden except administrators.
- View WLSDM Log Page is added
- Response Times Chart is added to Monitoring & Diagnostics > Response Times page
- User Defined Metric Actions feature is added. WebLogic domains can be automated according to MBean values
- All users and user groups able to login WLSDM console anymore. Page authorization is enriched
v1.2.0:
- Profiling Dumps page is added to "Monitoring & Diagnostics" category
- Grid status feature is added to dashboard pages
v1.1.2:
- Java Flight Recorder (JFR) dump action is added
- WLDF (WebLogic Diagnostic Framework) Diagnostic Image dump action is added
- Heap dump action is added
v1.1.0:
- Thread dump action is added