

v3.2.2 | Released on 2017.11.04
ALERT and CLEAR emails (HTML)CLEAR emails and notifications when problem disappeared THREAD, HEAP, JFR, CPU Sample and WLDF Image dumps when a defined case occurredBy using WLSDM, there is no need to write WLST scripts for getting WebLogic MBean metrics and scheduling it. Let WLSDM take care everything. WLSDM can access any values on WebLogic console.
ALERT and CLEAR notifications instantlyTips and Tricks: Access WLST Web Console and run custom WLST scripts by using WLSDM's WLST Web Console. It is possible to store and centralize custom WLST scripts on WLSDM.
WLSDM has a robust wizard which is aimed for setting up a WebLogic domain’s monitoring configurations easily and fast. This wizard is active only for the first login.WLSDM reads the WebLogic domain and offers important metrics to monitor.
After accepting the license agreement, WLSDM offers two options:
If you do not have a valid WLSDM license key, choose this option for the evaluation. After 30 days WLSDM will ask for a valid license.
If you have a valid WLSDM license key, choose this option and enter the appropriate license information. The license key will be checked off-line and activated instantly if it is a valid key.
In step 3, the SMTP settings and email recipients can be configured easily. These settings can be left blank, but it is highly recommended to configure these settings successfully.
By setting up email configuration WLSDM will send notifications and HTML email alerts.
Use "Send" button for testing SMTP settings. If you configured the SMTP settings successfully, you will get a test email as below.
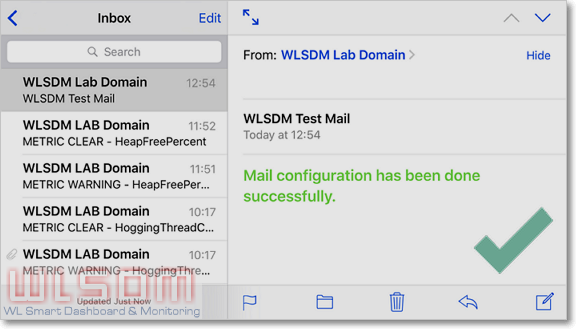
If any error occurs then checkwlsdm.logfile which is located under$WL_DOMAIN_HOME/WLSDM/logsfolder.
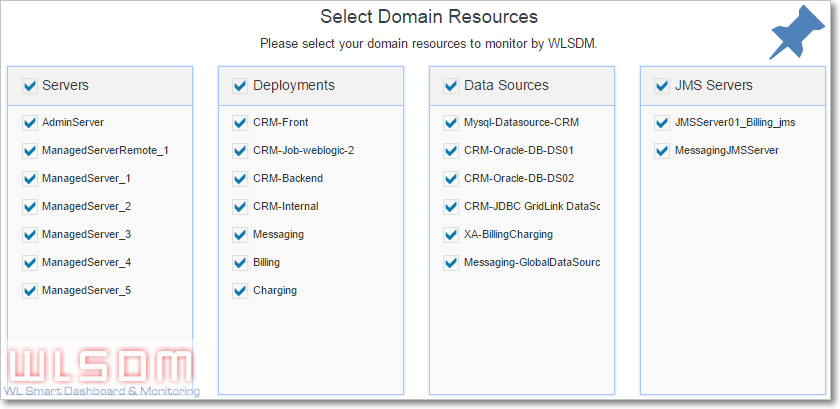
WLSDM reads WebLogic domain and lists the domain resources to configure monitoring settings.
There are four main groups which WLSDM offers to monitor: Servers, Deployments, Data Sources and JMS
Select domain resources to monitor. All important domain resources are selected by default. These can be unselected in this step.
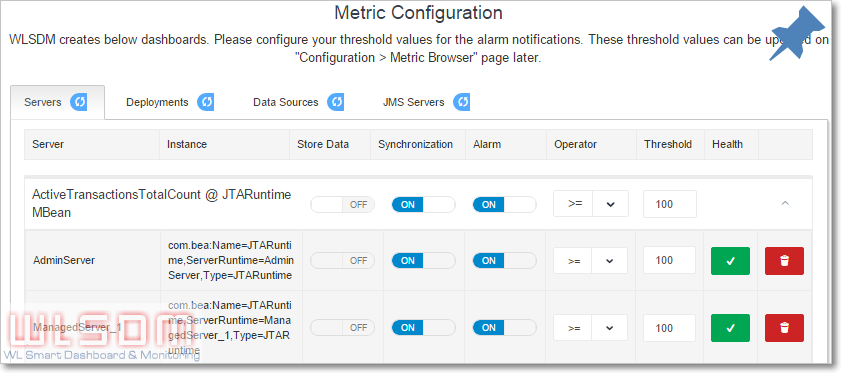
This is most important step and highly recommended to complete carefully. WLSDM offers important WebLogic MBean metrics to monitor according to domain’s available resources.
Complete Step-6 settings as:
There are three Monitoring&Diagnostic settings in this step. These are "Log Inspector", "Response Times Monitoring", "Back-end Systems" monitoring configurations.
Firstly, select profiling servers for Monitoring & Diagnostics.
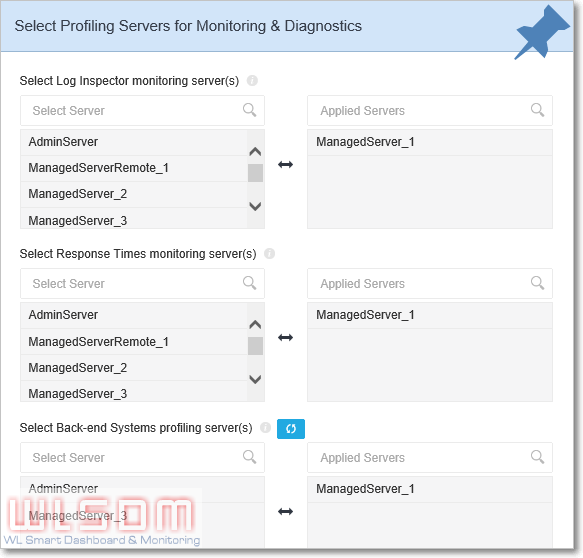
| Type | Description | Production Systems Best Practice |
|---|---|---|
| Log Inspector | Select at least one profiling server. | Select only one managed server among managed servers has same duty and settings. (i.e. cluster members) |
| Response Times | Select at least one profiling server. | Select only one managed server among managed servers has same duty and settings. (i.e. cluster members) |
| Back-end Systems | WLSDM agent must be installed. Only supported and WLSDM agent installed servers are listed. Select at least one profiling server. | Select only one managed server among managed servers has same duty and settings. (i.e. cluster members) |
All the Monitoring & Diagnostics settings (thresholds, WLDF queries, back-end events... etc.) can be edited on "Configuration > Monitoring & Diagnostics" page later.
It is unable to access to the wizard page after completing WLSDM Quick Configuration Wizard steps. But all the configurations and values can be listed or updated on Smart Dashboard, "Configuration > Metric Browser", "Configuration > Monitoring & Diagnostics" pages.
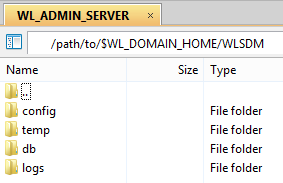
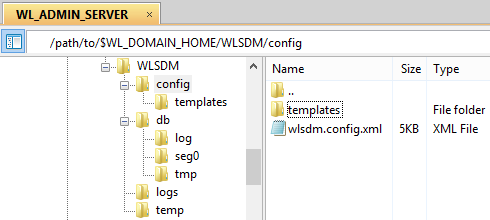
When WLSDM installed to a WebLogic domain, it creates "WLSDM" folder under WebLogic domain's home folder. Directory layout of WLSDM folder:
| Folder Name | Relative Path | Description |
|---|---|---|
| db | ${WL_DOMAIN_HOME}/WLSDM/db | WLSDM's embedded database folder. WLSDM uses embedded Apache Derby Database which comes with wlsdm.war file. There is no operational cost for maintaining WLSDM database, the console extension takes care everything. |
| config | ${WL_DOMAIN_HOME}/WLSDM/config | Configuration folder which consists of html email "templates" folder and main WLSDM config file wlsdm.config.xml |
| config/templates | ${WL_DOMAIN_HOME}/WLSDM/config/templates | HTML email templates folder. Edit these files for your HTML customizations. |
| logs | ${WL_DOMAIN_HOME}/WLSDM/logs | WLSDM default log folder. There are two log files, one is wlsdm.db.log the other one is wlsdm.log which is the main log file. |
| temp | ${WL_DOMAIN_HOME}/WLSDM/temp | This folder is using by WLSDM log inspector module for sending alert emails which have log attachments. |
| dumps | ${WL_DOMAIN_HOME}/WLSDM/dumps | WLSDM pofiling dump files are stored in this folder. Sub folders are: threaddump, jfr, heap, diagnostic_images |
| scripts | ${WL_DOMAIN_HOME}/WLSDM/scripts | Used by WLST Web Console and WLST scripts are stored in this folder. |
| archive | ${WL_DOMAIN_HOME}/WLSDM/archive | WLSDM archive folder. Purged data are stored in this folder. |
| monitorWLAdmin | ${WL_DOMAIN_HOME}/WLSDM/monitorWLAdmin | Standalone Java application for monitoring WebLogic Admin Server. Works as plug and play! |
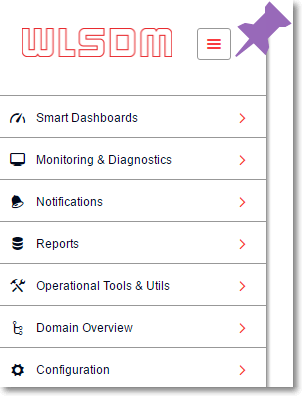
Main WLSDM menu is located on the left side and default is collapsed. It can be expand/collapse by menu icon.
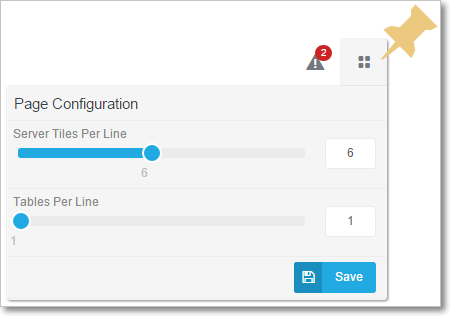
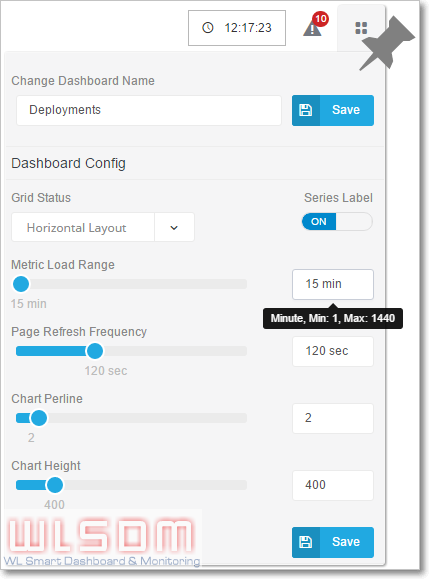
Page operations icon is located on the right top of every pages. Visual page settings and page functions can be list on page operations menu.
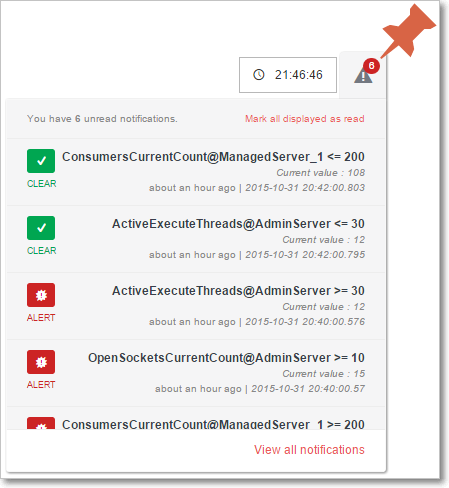
Summary metric notification window is located on the right top of every page.
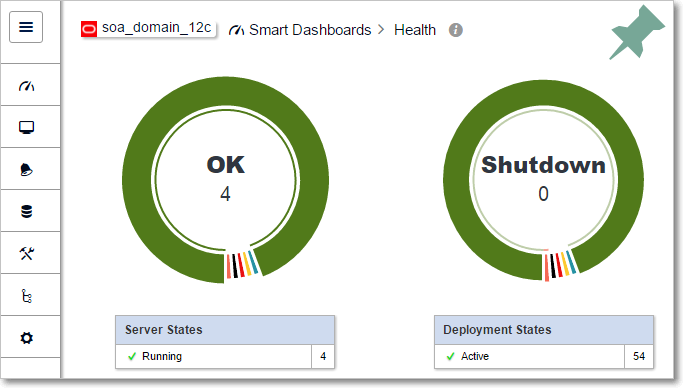
Health dashboard page is the home page of WLSDM and lists all the WebLogic domain resources at one page. All the states and health values is listed for per WebLogic server instance.
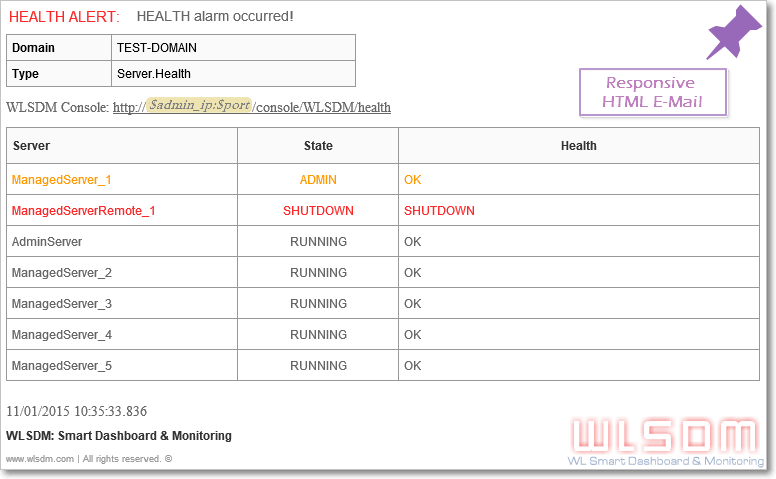
WLSDM checks these health and states periodically. If the health is not "OK" and state's value is not "RUNNING" for any resource, WLSDM generates "Health ALARM" and sends email notifications as below.
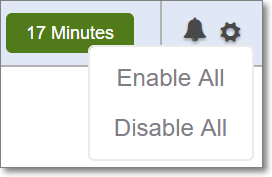
Health alarm notifications can be enabled/disabled for each resources (Servers, Applications, Data Sources and JMS) by clicking on alarm icon on the lists.
Servers, Deployments, Data Sources and JMS Servers dashboards are default dashboards which are created at wizard steps.
Dashboard page operations are as below:
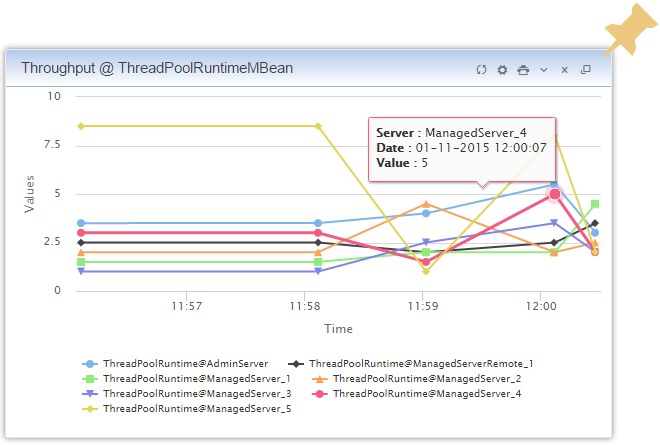
All metric and chart operation icons are located on the top right of charts.

Opens the "Metric and Chart" Options window. All the operations can be done on this window easily.
Important Feature:
A metric can be assign multiple dashboard on "Edit Dashboards" modal window as below.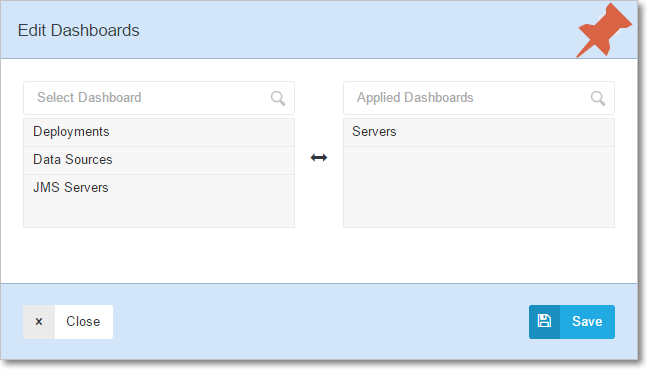
WLSDM generates a Dynamic MBean instance by using com.wlsdm.genericmbean.DevOpsMBean class and creates / populates its MBean attributes by user defined script output. All user defined scripts are stored in the WLSDM database and each script works once for each selected server through monitoring frequency. Each script / SQL statement has its own execution timeout and this value cannot be less than one second or cannot be more than thirty seconds. (Recommended / Default value is five seconds)
Generated DevOps MBean will be assigned to selected smart metric dashboard(s) on the configuration wizard and chart(s) will be visible on its smart dashboard. These MBean metrics are alive like any other MBean attributes (WebLogic metrics i.e. OpenSocketsCurrentCount).
MBeans are the managed Java objects and they represent Java classes.
A Java class cannot contain two or more attributes with the same name.
Script outputs are the source of MBean attributes. There two options to place script outputs in charts.
1. Attributes in Different Chart: Each script output attribute will be placed on different charts.
Generates one same MBean instance with the multiple MBean attribute name.
2. Attributes in Same Chart: All the script output attributes will be place in the same chart.
Generates multiple different MBean instance with the same MBean attribute Name.
This option creates multiple DevOps MBean instances for each attribute with the given name, i.e. ${YourMBeanName}_${AttrName}, on wizard.
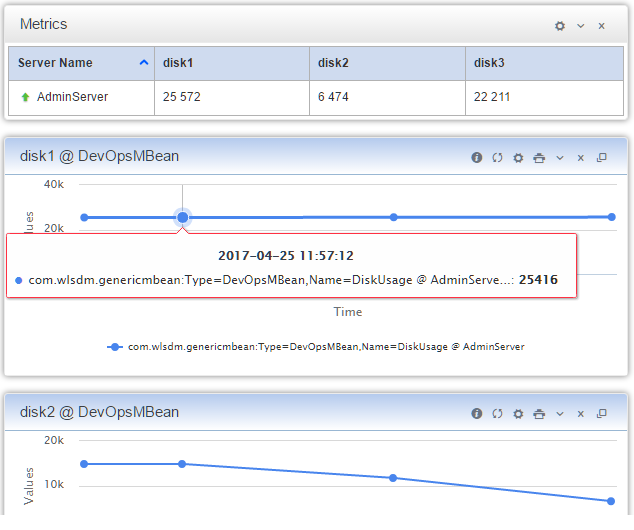
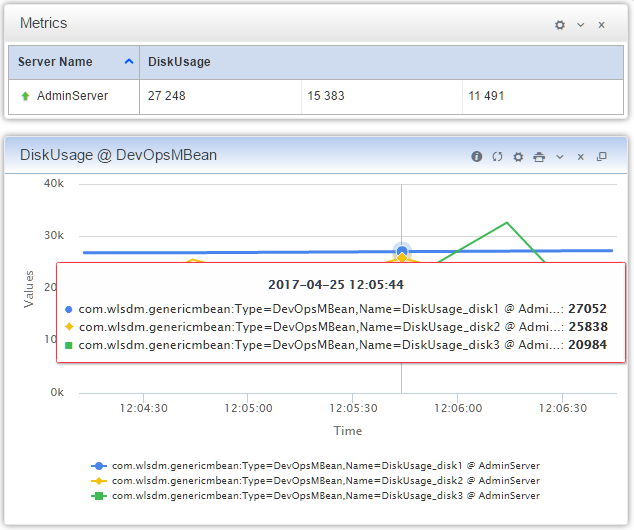
DevOps MBean generation and monitoring threads are independent and different processes. Each process has its own process controller and execution frequency. DevOps monitoring frequency value is editable on " Configuration > WLSDM System Settings" page.
Key / value pairs are the expected output format for the OS executable scripts. Sample output(echo) is listed below:
#attributeName=attributeValue
TotalCompletedOrders=2017
TotalWaitingOrders=35
Note: MBean attribute names cannot contain non alphanumeric characters except underscore ( _ ). Non-alphanumeric characters must be replaced.
Sample Shell Script - 1 : Disk usage of a Linux server
#Author: WLSDM
df -H | grep -vE '^Filesystem|tmpfs|lv|dev' | awk '{ print $5"="$4}' | sed 's/%//' | sed '1s/\//ROOT/'
Sample Shell Script - 1 Output :
ROOT=85
data=67
u01=76
Sample Shell Script - 2 : Ping database and calculate database respone time using WebLogic API (weblogic.jar)
#Author: WLSDM | 2017

#Variables
_dbStatus=0
#0:DB_DOWN,1:DB_UP

#start DB Ping
_startTime=$(($(date +%s%N)/1000000))
_pingResult=`java -cp weblogic.jar utils.dbping ORACLE_THIN $YOUR_USER_NAME $YOUR_PASSWORD $YOUR_IP:$YOUR_PORT/$YOUR_SERVICE_NAME`
_endTime=$(($(date +%s%N)/1000000))
_dbResponseTime=`expr $_endTime - $_startTime`

if [[ "$_pingResult" == *"Success!!!"* ]]; then
  _dbStatus=1
  #echo "Database connection SUCCESS!!!"
  #DB_UP
  echo DatabaseStatus=$_dbStatus
else
  _dbStatus=0
  #echo "Database connection FAILURE!!!"
  #DB_DOWN
  echo DatabaseStatus=$_dbStatus
fi
echo DatabaseResponseTime=$_dbResponseTime
Sample Shell Script - 2 Output :
DatabaseStatus=1
DatabaseResponseTime=1218WLSDM supports two parsing method for SQL script results as MBean attribute generation. As OS Executable Script output, key / value pairs are the expected output for SQL statement results.

Table column or SQL statement result column names are accepted as MBean attribute name (key) and first row of column values are accepted as MBean attribute value. Column names and column orders must be static and SQL result set must have only ONE row data.
select
    AttributeName1, AttributeName2
from
    MyTable
where
ROWNUM=1| AttributeName1 | AttributeName2 |
|---|---|
| AttributeValue1 | AttributeValue2 |
Each row (in result set) accepted as attribute key / value pair. First column value is attribute name and second column value is attribute value.
select
    Column1,
    count(*) as Column2
from
    MyTable
where
    Column1 <= 3 -- static result
group by Column1
order by 1| Column1 | Column2 |
|---|---|
| AttributeName1 | AttributeValue1 |
| AttributeName2 | AttributeValue2 |
| AttributeName3 | AttributeValue3 |
Sample SQL Script : Active sessions grouped by machine (Oracle Database)
select
    status,
    count(*)
from
    gv$session
group by status
order by 1| STATUS | COUNT(*) |
|---|---|
| ACTIVE | 54 |
| INACTIVE | 21 |