WLSDM Help
v2.5.2 | Released on 2016.11.01
1. Introduction
WLSDM is an enterprise "WebLogic console extension" which enables monitoring for WebLogic JMX MBean metrics, all the WebLogic domain assets (Health, Servers, Applications, Data Sources, JMS… etc.) and back-end systems monitoring (JDBC, EJB, JAXWS WebServices, Servlets). It is very easy to create alarm and notification definitions by using WLSDM metric browser. WLSDM can store any WebLogic metric values historically and also can generate graphical reports.
WLSDM is a WebLogic Console extension and runs under WebLogic console on Admin server.
1.1. Important WLSDM Features
- Deploy just in minutes
- Responsive user interface
- Responsive charts
- Configure domain monitoring with WLSDM set-up wizard
- Get alarms and notifications
- Robust alarm generation infrastructure (Parametric alarm counter support)
- Customize email templates according to your organization
- Fancy and responsive ALERT and CLEAR emails (HTML)
- Get CLEAR emails and notifications when problem disappeared
- Create unlimited dashboards
- Responsive health page for WebLogic domain assets
- Monitor and visualize applications' response times
- Monitor and visualize WebLogic logs by using WLSDM log inspector
- Store WebLogic JMX metric values historically
- Get JVM THREAD, HEAP, JFR and WLDF Image dumps when a defined case occurred
- Get manual profiling dumps for JFR, Thread Dump, WLDF Diagnostic Image and Heap Dump
- Generate reports
- Localize (language) and customize HTML email's content, subject, header… etc.
- Customize and configure WLSDM settings (SMTP, Email content, Logging… etc.)
- Back-end Monitoring for JDBC, EJB and JAXWS WebServices
- WLST Web Console: Storing and centralizing WLST Scripts
- Decrypt-Encrypt WebLogic Passwords
- Summarize and Compare WebLogic domain settings on Domain Summary page
- Analyze thread dumps by using Thread Dump Analyzer
- Send SNMP traps for WebLogic Instance States, Health, MBean Metrics and WebLogic server logs
- Integrate User Defined Metric Actions for MBean thresholds
1.2. WLSDM Functionality and Easy Usage
By using WLSDM, there is no need to write WLST scripts for getting WebLogic MBean metrics and scheduling it. Let WLSDM take care everything. WLSDM can access any values on WebLogic console.
- Add metric monitoring by using WLSDM metric browser
- Enable monitoring and storing data
- Specify threshold values for the metrics
- Monitor values on dashboards with fancy charts
- Get ALERT and CLEAR notifications instantly
- Access historical data and generate reports
1.3. Administrative and DevOps WLSDM Features
- Free Developer Edition (Fully Featured) - WLSDM can be used by developers for free!
- WLSDM Quick installation Wizard is more robust anymore. Monitoring & Diagnostics step is added
- Suggest Button for Metric Thresholds on Wizard pages
- Get manual profiling dumps for JFR, Thread Dump, WLDF Diagnostic Image and Heap Dump
- Self-Tuning Thread Pool Threads detail is added for HoggingThreadCount and StuckThreadCount EMAIL notifications
-
Back-end system monitoring
- JDBC Executement Statement
- Webservices JAXWS Endpoint
- EJB Business Method Invoke
- Back-end Reports page is added
- Operational Tools section is added
- WLST Web Console Page
- Storing and Executing WLST Scripts
- Thread Dump Analyzer Page
- Decrypt-Encrypt Page
- Notifications are enriched
- Metric Notifications
- Log Inspector Notifications
- Response Times Notifications
- Back-end Systems Notifications
- Enable/Disable Global Notifications for EMAIL and SNMP By One By
- Enable/Disable All EMAIL-SNMP Notifications feature is added
- SNMP Notification feature is added. Easy SNMP trap configuration:
- SNMP Trap for WebLogic State and Health (Servers, Deployments, Data Sources and JMS)
- SNMP Trap MBean Metric Values
- SNMP Trap for WebLogic Server Logs
- Test SMTP and SNMP settings operations are added to Configuration > System page
- Log Inspector WLDF snippets are added
- Dead Lock
- Heap Space
- Stuck Thread
- Unchecked Exception
- General Severity Error
- WebLogic Domain Summary Page is added
- Data source passwords are listed on domain summary page (Decrypted and Encrypted) - All users are forbidden except administrators.
- View WLSDM Log Page is added
- Response Times Chart is added to Monitoring & Diagnostics > Response Times page
- User Defined Metric Actions feature is added. WebLogic domains can be automated according to MBean values
- Anymore all users and user groups able to login WLSDM console. Page authorization is enriched.
Tips and Tricks: Access WLST Web Console and run custom WLST scripts by using WLSDM's WLST Web Console. It is possible to store and centralize custom WLST scripts on WLSDM.
1.4. WLSDM SOA Module: Monitoring, Diagnostics & Reports
- SOA Smart Dashboards
- Monitoring BPEL Engine (Only 11g)
- BPEL Engine Dashboard (Historical - Only 11g)
- Monitoring Composite Performance
- Monitoring Callback and Invoke
- Monitoring Composite Faults
- Monitoring Deployed Composites Trend
- Summarizing Composite List & Endpoint URIs
- SOA Notifications and Alarms
- BPEL Engine Notifications
- Composite Performance Notifications
- Callback and Invoke (DLV_MESSAGE) Notifications
- Composite Faults and Errors Notifications
- SOA Reports
- Reporting SOA BPEL Engine
- Reporting SOA Composite Performance
- Reporting SOA Callback and Invoke (DLV_MESSAGE)
- Reporting SOA Composite Faults and Errors
- SOA Daily Reports (EMAIL)
- Daily SOA Report for Composite Performance
- Daily SOA Report for Callback and Invoke (DLV_MESSAGE)
- Daily SOA Report for Composite Faults and Errors
- Daily SOA Report for Deployed Composites Trend
2. Installation
2.1. Detailed Installation
Unix-Linux Windows MAC OS X
Summary:
- Add wlsdm_agent.jar to managed server's JVM Arguments ${JAVA_OPTIONS}*
- Copy wlsdm.war file to WebLogic domain's console-ext folder.
- (Re)start WebLogic admin server and managed server(s).
- That's all! WLSDM console will deploy automatically.
- Login to WLSDM Console then complete configuration wizard for once.
- Start proactive monitoring and move forward your WebLogic management infrastructure and team!
Detailed Step by Step Installation Guide (Already Running Domain)
 1. copy $wlsdm_package/jar/wlsdm_agent.jar to /path/to/wlsdm_agent.jar on the managed server machine(s)

            [user@machine]$ mkdir $DOMAIN_HOME/wlsdm_agent
            [user@machine]$ cp $wlsdm_package/jar/wlsdm_agent.jar $DOMAIN_HOME/wlsdm_agent/wlsdm_agent.jar
2. add wlsdm_agent.jar to WebLogic managed server´s JVM Arguments as below: --> *${JAVA_OPTIONS}
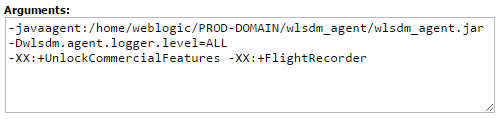
(Recommended at least one...) *2.1. JRockit and JDK 1.6: Add the following WLSDM JVM parameters to WebLogic managed server´s JVM Arguments: -javaagent:/path/to/wlsdm_agent.jar -Dwlsdm.agent.logger.level=INFO *2.2. Lower JDK 1.7.0_40: Add the following WLSDM JVM parameters to managed server´s JVM Arguments: -javaagent:/path/to/wlsdm_agent.jar -Dwlsdm.agent.logger.level=INFO *2.3. JDK 1.7.0_40 and Higher and JDK 1.8: Add the following WLSDM & JFR JVM parameters to managed server´s JVM Arguments: -javaagent:/path/to/wlsdm_agent.jar -Dwlsdm.agent.logger.level=INFO -XX:+UnlockCommercialFeatures -XX:+FlightRecorder
How to add WLSDM JVM Parameters to WebLogic managed server arguments? 1- With WebLogic NodeManager: To instrument managed server instances started and stopped through the Node Manager, use the administration console.
From the administration console, navigate to "Environments > Servers > (select your server) > Server Start > Arguments" Add the above suitable JVM entry under Arguments and save the page:
Environments > Servers > (select your server) > Server Start > Arguments
2- Without WebLogic NodeManager: Add the following entry (add before Java executes) to the "startManagedServer" file UNIX / LINUX / MAC OS X:"startManagedServer.sh"export JAVA_OPTIONS="$JAVA_OPTIONS -javaagent:/path/to/wlsdm_agent.jar -Dwlsdm.agent.logger.level=INFO -XX:+UnlockCommercialFeatures -XX:+FlightRecorder"WINDOWS:"startManagedServer.cmd"set JAVA_OPTIONS=%JAVA_OPTIONS% -javaagent:"C:\path\to\wlsdm_agent.jar" -Dwlsdm.agent.logger.level=INFO -XX:+UnlockCommercialFeatures -XX:+FlightRecorderNOTE: There is no need to install "wlsdm_agent.jar" to the WebLogic Admin Server!
3. (re)start WebLogic managed server(s) which wlsdm_agent.jar is installed. after restarting managed server(s), below logs must be seen in managed server log files. this means WLSDM agent is deployed successfully. Managed Server Log:<Mar 4, 2015 1:13:24 PM PDT> <Info> <WLSDM> <BEA-000000> <WLSDM agent loaded successfully.> <Mar 4, 2015 1:13:24 PM PDT> <Info> <WLSDM> <BEA-000000> <RJVM operation is bound in the registry with the name wlsdm_agent_remote_operation.>
4. copy $wlsdm_package/war/wlsdm.war to ${WEBLOGIC_DOMAIN_HOME}/console-ext/. folder on the admin server machine
5. then (re)start WebLogic admin server. that is all, WLSDM console will deploy automatically. after restarting admin server, below logs must be seen in admin server log files. this means WLSDM console is deployed successfully and WLSDM console is ready to monitor WebLogic domain. Admin Server Log:<Mar 4, 2015 1:12:12 PM PDT> <Info> <WLSDM> <BEA-000000> <WLSDM console deployed successfully.> <Mar 4, 2015 1:12:12 PM PDT> <Info> <WLSDM> <BEA-000000> <WLSDM metric monitoring initialized successfully.> <Mar 4, 2015 1:12:12 PM PDT> <Info> <WLSDM> <BEA-000000> <WLSDM health monitoring initialized successfully.> <Mar 4, 2015 1:12:12 PM PDT> <Info> <WLSDM> <BEA-000000> <WLSDM performance monitoring initialized successfully.> <Mar 4, 2015 1:12:12 PM PDT> <Info> <WLSDM> <BEA-000000> <WLSDM back-end monitoring initialized successfully.>
 6. make sure all your WebLogic domain resources (wl servers, deployments, data sources, jms servers... etc.)
    are RUNNING and ACTIVE
 7. access WLSDM console: http://$IP:$PORT/console/WLSDM
   How to access WLSDM console?
 8. complete WLSDM quick configuration wizard carefully according to WebLogic domain characteristic
   How to complete WLSDM wizard?
Optional: There is no need to install wlsdm_agent.jar for monitoring JMX MBean Objects, WebLogic Logs and Application Response Times. $wlsdm_package/jar/wlsdm_agent.jar must be installed for back-end monitoring and remote JVM actions. It is highly recommended to install at least on one managed server.
Important Note: WLSDM agent has almost zero overhead on managed server resources and it is only used for RJVM operations. Its cost is negligible. WLSDM injecting nothing to runtime codes.
2.2. Accessing WLSDM Console
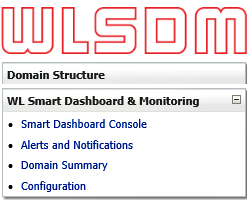
After the installation, login to WebLogic admin console then WLSDM portlet will be visible under WebLogic domain structure.
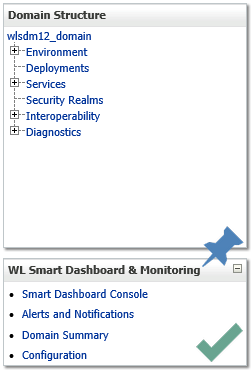
Click "Smart Dashboard Console" on WLSDM menu.
OR
Type WLSDM URL on browser's address bar for accessing directly.
http:// ${ADMIN_SERVER_IP} : ${PORT} /console/WLSDM
https:// ${ADMIN_SERVER_IP} : ${PORT} /console/WLSDM
2.3. WLSDM Acess Role
3. Completing WLSDM Wizard
WLSDM has a robust wizard which is aimed for setting up a WebLogic domain’s monitoring configurations easily and fast. This wizard is active only for the first login. WLSDM reads the WebLogic domain and offers important metrics to monitor.
3.1. WLSDM Quick Configuration Wizard
Step 1: Welcome: Wizard introduction
Step 2: License Information
After accepting the license agreement, WLSDM offers two options:
- Evaluate for 15 days:
- Enter license key:
If you do not have a valid WLSDM license key, choose this option for the evaluation. After 15 days WLSDM will ask for a valid license.
If you have a valid WLSDM license key, choose this option and enter the appropriate license information. The license key will be checked off-line and activated instantly if it is a valid key.
Step 3: Alarm Configuration
Optional, Highly Recommended
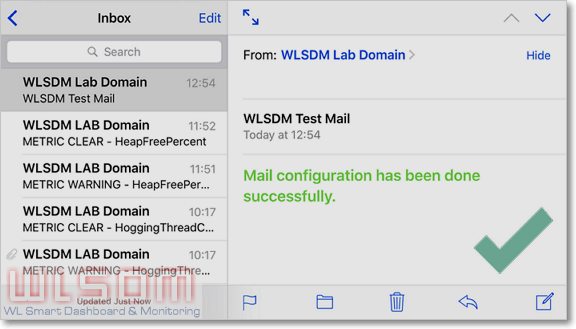
In step 3, the SMTP settings and email recipients can be configured easily. These settings can be left blank, but it is highly recommended to configure these settings successfully.
By setting up email configuration WLSDM will send notifications and HTML email alerts.
Use "Send" button for testing SMTP settings. If you configured the SMTP settings successfully, you will get a test email as below.
If any error occurs then check wlsdm.log file which is located under $WL_DOMAIN_HOME/WLSDM/logs folder.
Step 4: Reading Domain
WLSDM reads WebLogic domain and lists the domain resources to configure monitoring settings.
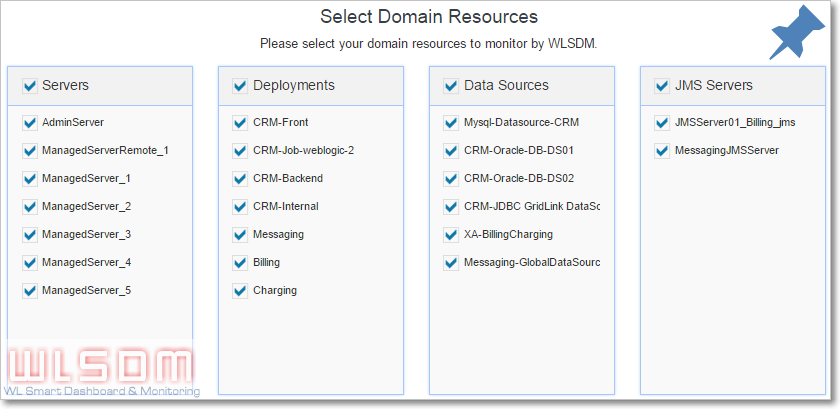
Step 5: Domain Resources
There are four main groups which WLSDM offers to monitor: Servers, Deployments, Data Sources and JMS
Select domain resources to monitor. All important domain resources are selected by default. These can be unselected in this step.
Step 6: Metric Configuration
This is most important step and highly recommended to complete carefully. WLSDM offers important WebLogic MBean metrics to monitor according to domain’s available resources.
Complete Step-6 settings as:
| 1. Check metric values | All available metrics are grouped by WebLogic servers. All the sub instance threshold values can be set on main metric record. Click on threshold edit-box and see current instance values. |
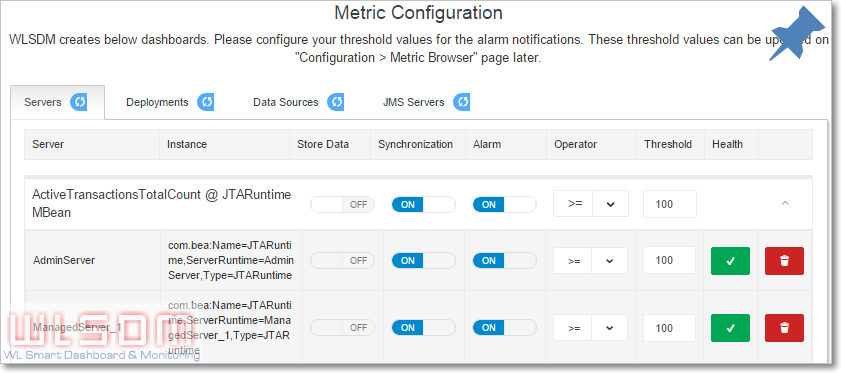
| 2. Set threshold values | Give reasonable threshold values according to the WebLogic domain characteristic. |
| 3. Enable/Disable alarm | It can be done by using ON/OFF button on "Alarm" column. |
| 4. Delete metric instance | It is also possible to remove the metric instance. |
| 5. Reset values and configurations | All the configurations, values and deletion processes can be reset by clicking on refresh icons on metric group tabs. |
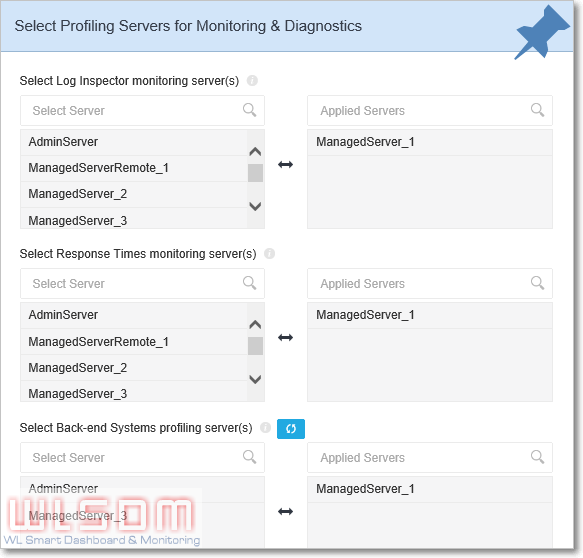
Step 7: Monitoring & Diagnostics
There are three Monitoring&Diagnostic settings in this step. These are "Log Inspector", "Response Times Monitoring", "Back-end Systems" monitoring configurations.
Firstly, select profiling servers for Monitoring & Diagnostics.
| Type | Description | Production Systems Best Practice |
|---|---|---|
| Log Inspector | Select at least one profiling server. | Select only one managed server among managed servers has same duty and settings. (i.e. cluster members) |
| Response Times | Select at least one profiling server. | Select only one managed server among managed servers has same duty and settings. (i.e. cluster members) |
| Back-end Systems | WLSDM agent must be installed. Only supported and WLSDM agent installed servers are listed. Select at least one profiling server. | Select only one managed server among managed servers has same duty and settings. (i.e. cluster members) |
All the Monitoring & Diagnostics settings (thresholds, WLDF queries, back-end events... etc.) can be edited on "Configuration > Monitoring & Diagnostics" page later.
Step 8: Finish
It is unable to access to the wizard page after completing WLSDM Quick Configuration Wizard steps. But all the configurations and values can be listed or updated on Smart Dashboard, "Configuration > Metric Browser", "Configuration > Monitoring & Diagnostics" pages.
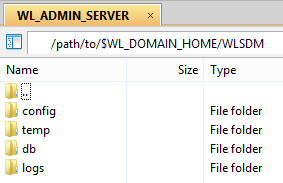
4. Runtime {WLSDM} Folder Structure
When WLSDM installed to a WebLogic domain, it creates "WLSDM" folder under WebLogic domain's home folder. Directory layout of WLSDM folder:
| Folder Name | Relative Path | Description |
|---|---|---|
| db | ${WL_DOMAIN_HOME}/WLSDM/db | WLSDM's embedded database folder. WLSDM uses embedded Apache Derby Database which comes with wlsdm.war file. There is no operational cost for maintaining WLSDM database, the console extension takes care everything. |
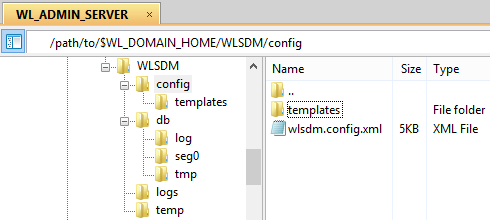
| config | ${WL_DOMAIN_HOME}/WLSDM/config | Configuration folder which consists of html email "templates" folder and main WLSDM config file wlsdm.config.xml |
| config/templates | ${WL_DOMAIN_HOME}/WLSDM/config/templates | HTML email templates folder. Edit these files for your HTML customizations. |
| logs | ${WL_DOMAIN_HOME}/WLSDM/logs | WLSDM default log folder. There are two log files, one is wlsdm.db.log the other one is wlsdm.log which is the main log file. |
| temp | ${WL_DOMAIN_HOME}/WLSDM/temp | This folder is using by WLSDM log inspector module for sending alert emails which have log attachments. |
| dumps | ${WL_DOMAIN_HOME}/WLSDM/dumps | WLSDM pofiling dump files are stored in this folder. Sub folders are: threaddump, jfr, heap, diagnostic_images |
| scripts | ${WL_DOMAIN_HOME}/WLSDM/scripts | Used by WLST Web Console and WLST scripts are stored in this folder. |
| archive | ${WL_DOMAIN_HOME}/WLSDM/archive | WLSDM archive folder. Purged data are stored in this folder. |
| monitorWLAdmin | ${WL_DOMAIN_HOME}/WLSDM/monitorWLAdmin | Standalone Java application for monitoring WebLogic Admin Server. Works as plug and play! |
5. WLSDM Console Usage
5.1. General Usage
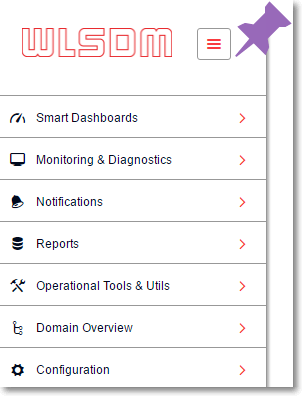
Main WLSDM menu is located on the left side and default is collapsed. It can be expand/collapse by menu icon.
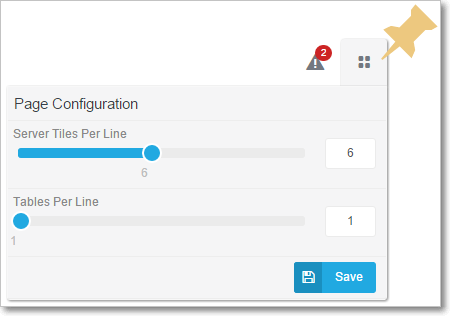
Page operations icon is located on the right top of every pages. Visual page settings and page functions can be list on page operations menu.
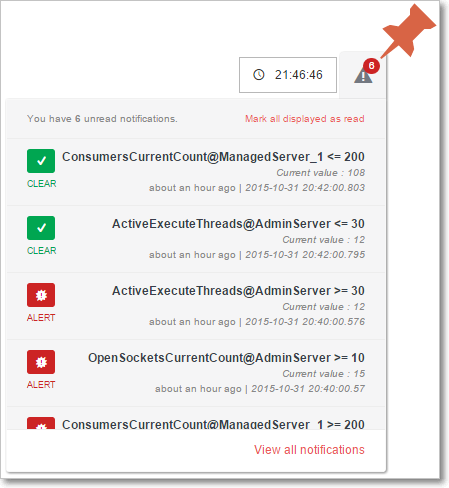
Summary metric notification window is located on the right top of every page.
5.2. Smart Dashboards Usage
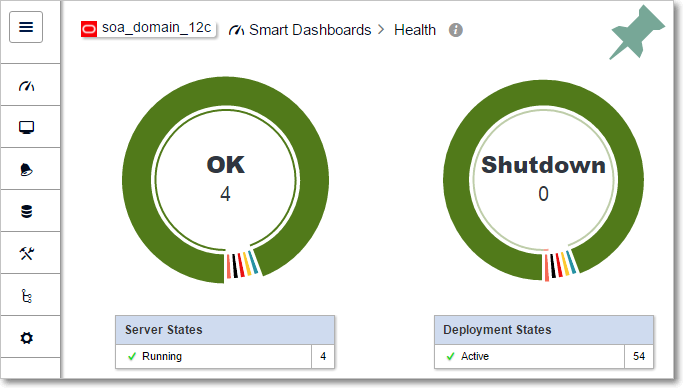
Health Dashboard
Health dashboard page is the home page of WLSDM and lists all the WebLogic domain resources at one page. All the states and health values is listed for per WebLogic server instance.
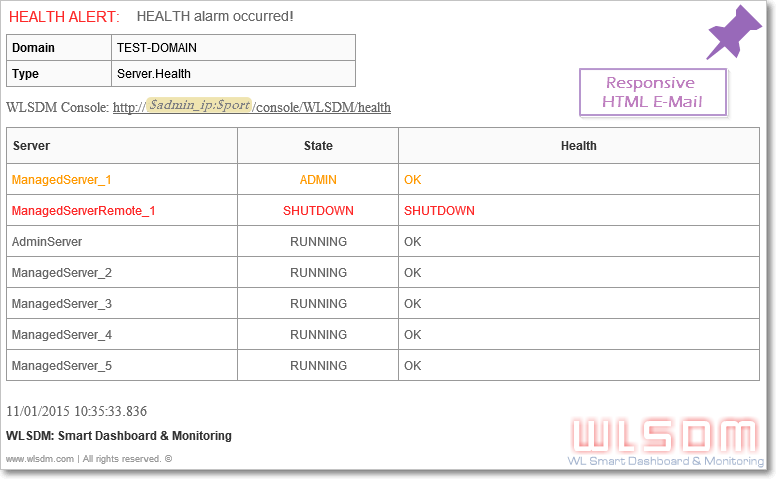
Health Notifications
WLSDM checks these health and states periodically. If the health is not "OK" and state's value is not "RUNNING" for any resource, WLSDM generates "Health ALARM" and sends email notifications as below.
Using Health Dashboard
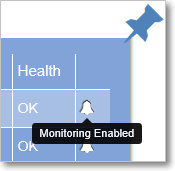
Health alarm notifications can be enabled/disabled for each resources (Servers, Applications, Data Sources and JMS) by clicking on alarm icon on the lists.
Default Dashboards
Servers, Deployments, Data Sources and JMS Servers dashboards are default dashboards which are created at wizard steps.
Dashboard page operations are as below:
- Can update dashboard name
- Can change "Metric Load Range" historically (Minimum 1 minute)
- Can change automatic "Page Refresh Frequency" (Minimum 30 seconds)
- Can change number of charts per line (Minimum 1 chart)
- Can change chart heights (Minimum 100px)
- Can change grid display status (Show / Hide)
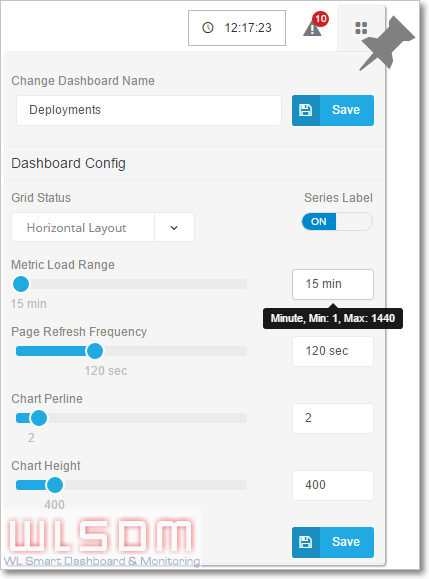
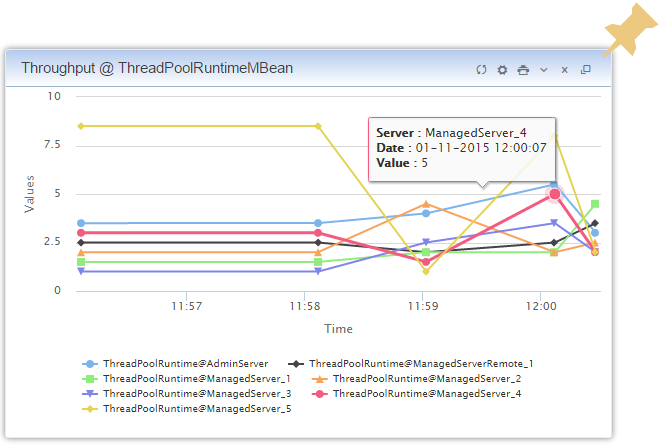
Chart Usage on Dashboard Pages
All metric and chart operation icons are located on the top right of charts.
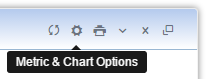
- Metric & Chart Options: Opens metric options window
- Print: Print window is opened and it is possible to save the charts as PDF document
- Show/Hide: Opens/Closes chart display
- Reload: Reloads metric values for the current chart (Loads the current values of WebLogic MBeans)
- Close: Removes the chart occurrence on the page. When page refreshes the chart is loaded again.
Metric and Chart Options
Opens the "Metric and Chart" Options window. All the operations can be done on this window easily.
- Can change "Metric Chart Type"
- Alarm settings (ON / OFF)
- Action settings (Thread Dump, Heap Dump, Java Flight Recorder Dump, WLDF Diagnostic Image)
- Synchronization settings (Controlling extended WebLogic servers)
- Monitoring metric instance health
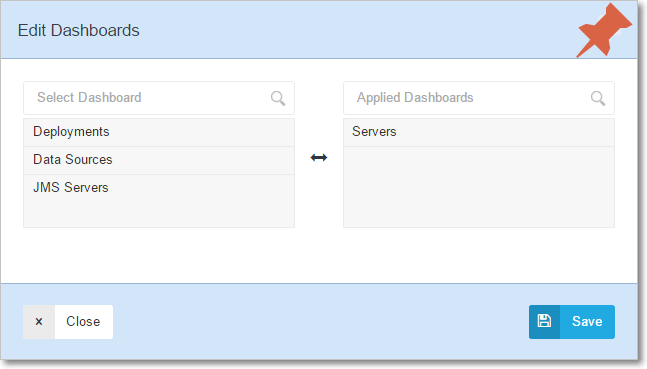
- Can change metric's dashboard settings to show on which dashboard to display
Important Feature: A metric can be assign multiple dashboard on "Edit Dashboards" modal window as below.